Visualizing Business Strategy through Product Service Composition Diagram
RM0100011_27
- Last Update 10/05/2025
- File Size 2.7MB
- # of Slides 2
- File Format PPTX
- Slide Ratio 16:9
- Color
Keywords
- #Content-Based Slides
- #Design-Based Slides
- #Business Vision and Strategy
- #Technical Approach
- #Diagram
- #Business Strategy
- #Service Architecture Diagram
- #Flow
- #Multidirectional Flow
- #16:9
- #radial diagram PowerPoint
- #business strategy presentation slide
- #strategy visualization PPT
- #3-node diagram template
- #how to create business strategy diagram in PowerPoint
About the Product
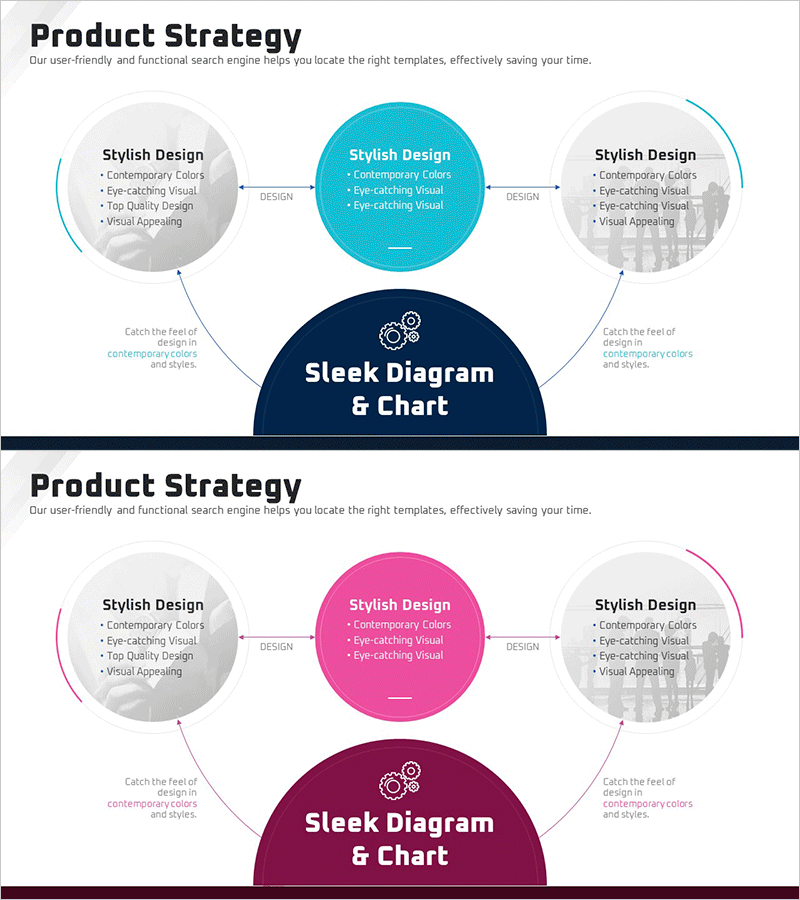
A radial business strategy visualization PowerPoint slide where three key elements branch outward from a central hub concept. The dark navy semicircular area at the center anchors the core strategy, while three circular nodes positioned at upper left, center, and upper right represent supporting elements (stylish design, contemporary colors, eye-catching visuals) connected by directional arrows and lines. The design uses contrasting colors—turquoise, magenta, and dark navy—to distinguish each strategic area. Two-slide set includes color variations so you can match your presentation tone. Ideal for business strategy presentations, product composition explanations, marketing positioning, and investor pitches where relationships between core concepts and supporting elements need clear visual hierarchy.
Usage Points
-
Main Usage
Designed to visually represent how a core business strategy concept connects to and influences three supporting strategic elements. Perfect for illustrating product-service composition, three pillars of marketing strategy, business objectives with execution components, or any hub-and-spoke relationship where information radiates from a central concept.
-
How to Use
Enter your core strategy name in the central dark navy semicircular area. Add supporting strategy elements to the three circular nodes at upper positions. Customize node colors and text styling to match your organization's brand palette. The connecting lines and arrows emphasize information flow; additional nodes can be added if needed. All shapes are fully editable.
-
Recommended For
Executive strategy presentations, marketing team positioning briefings, product team service composition introductions, investor relations materials, and board-level strategic planning sessions. Particularly effective when you need to show how a central concept drives or connects to multiple supporting initiatives.
-
Slide Structure
Two-slide set featuring identical radial structure with two color variations: turquoise-dominant and magenta-dominant versions. Each slide contains one central dark navy semicircle, three upper-positioned circular nodes, connecting lines, and directional arrows. All elements are editable shapes compatible with standard PowerPoint editing tools.
Related Products
-

Sea Lighthouse Business Strategy Arrow – Toward Vision and Goals
#Product/Service Introduction #Business Vision and Strategy #Diagram
-

Strategy for Structuring and Executing Lessons – Effective Multidirectional Flow Design
#Business Vision and Strategy #Technical Approach #Diagram
-

Weather-Based Temperature Analysis Diagram – Area Graph for Competitor Analysis
#Business Vision and Strategy #Marketing Plan and Strategy #Diagram
-

Multidirectional Flow Diagram for Business System Architecture
#Technical Approach #Diagram #Service Architecture Diagram
