Gear Diagram & Table – Business Strategy and Marketing Plan
RJ0400052_28
- Last Update 05/31/2025
- File Size 6.7MB
- # of Slides 2
- File Format PPTX
- Slide Ratio 16:9
- Color
Keywords
- #Content-Based Slides
- #Design-Based Slides
- #Business Vision and Strategy
- #Marketing Plan and Strategy
- #Diagram
- #Business Strategy
- #Marketing Strategy
- #Flow
- #Table
- #Multidirectional Flow
- #16:9
- #gear diagram PowerPoint
- #3-step process slide
- #business strategy PPT slide
- #marketing plan diagram
- #data visualization PowerPoint
- #process flow diagram template
About the Product
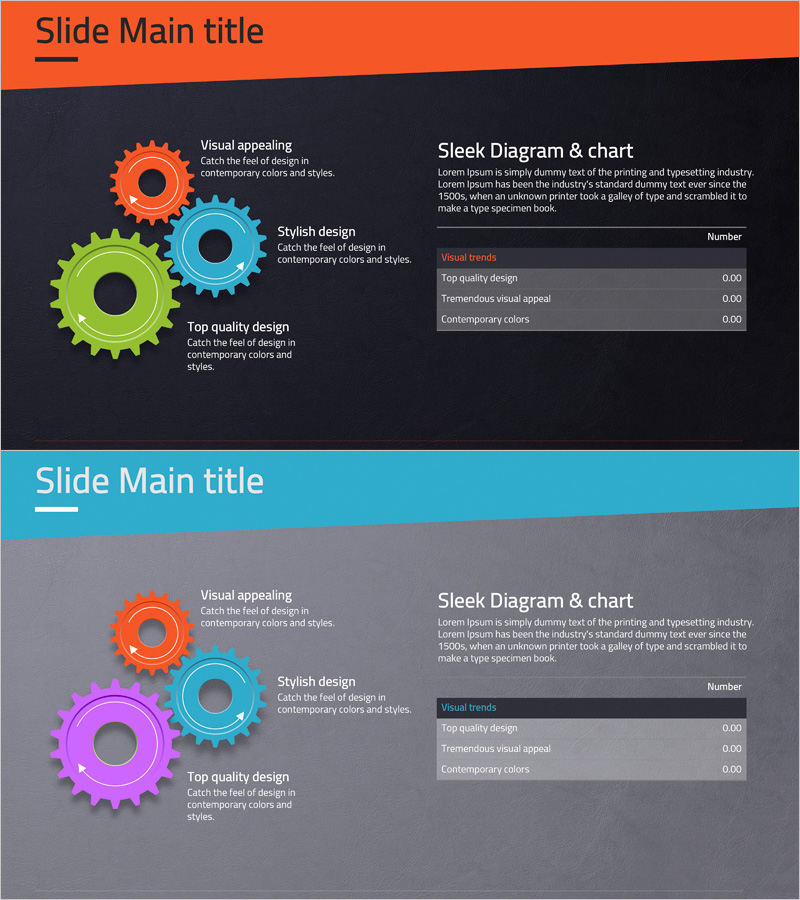
A professional PowerPoint slide combining a three-gear diagram in orange, cyan, and lime with an integrated data table. The 2-slide set features a central gear arrangement on the first slide with descriptive text for each element, and a matching gear structure paired with a data table on the second slide for numerical visualization. Dark background with bright color contrast enhances presentation impact and works seamlessly for business strategy, marketing planning, and operational process explanations. All elements are fully editable, allowing you to customize colors, text, and data values to match your presentation needs.
Usage Points
-
Main Usage
The gear diagram visualizes the interaction, interdependence, and integrated workflow of three key elements. It effectively illustrates how multiple strategic components work together in business planning and shows the coordination structure of marketing initiatives. The table slide combines the gear visual with numerical data, enabling simultaneous presentation of qualitative and quantitative information.
-
How to Use
On the first slide, input strategy element names into each gear node and add detailed explanations in the right text area. On the second slide, maintain the gear structure while populating the table with metrics, targets, or performance data to present data-driven analysis. Colors are customizable by category, and slide order can be adjusted based on presentation flow.
-
Recommended For
Business strategists, marketing managers, and operations leaders presenting process workflows to executives, team members, and stakeholders. Suitable for consulting reports, business plans, marketing proposals, and performance analysis presentations. Particularly effective for manufacturing, distribution, and service industries explaining production workflows or cross-departmental collaboration structures.
-
Slide Structure
Slide 1: Three interlocking gears in orange, cyan, and lime positioned centrally with text boxes aligned to each gear. Slide 2: Identical gear arrangement on the left with a 4-row × 3-column data table on the right. All shapes, text, and table cells are independently editable and optimized for 16:9 widescreen format.
Related Products
-

Business Marketing Strategy Table – The Foundation for Effective Planning
#Business Vision and Strategy #Marketing Plan and Strategy #Diagram
-

Weather-Based Temperature Analysis Diagram – Area Graph for Competitor Analysis
#Business Vision and Strategy #Marketing Plan and Strategy #Diagram
-

Marketing Strategy & Table of Contents – Cluster Design for Data Visualization
#Business Vision and Strategy #Marketing Plan and Strategy #Diagram
-

Marketing Strategy Arrow Diagram – Illustrating Business Flow
#Business Vision and Strategy #Marketing Plan and Strategy #Diagram
