Introduction to Business History – Utilizing a Cluster Diagram
RM0100009_5
- Last Update 01/27/2025
- File Size 0.9MB
- # of Slides 2
- File Format PPTX
- Slide Ratio 16:9
- Color
Keywords
About the Product
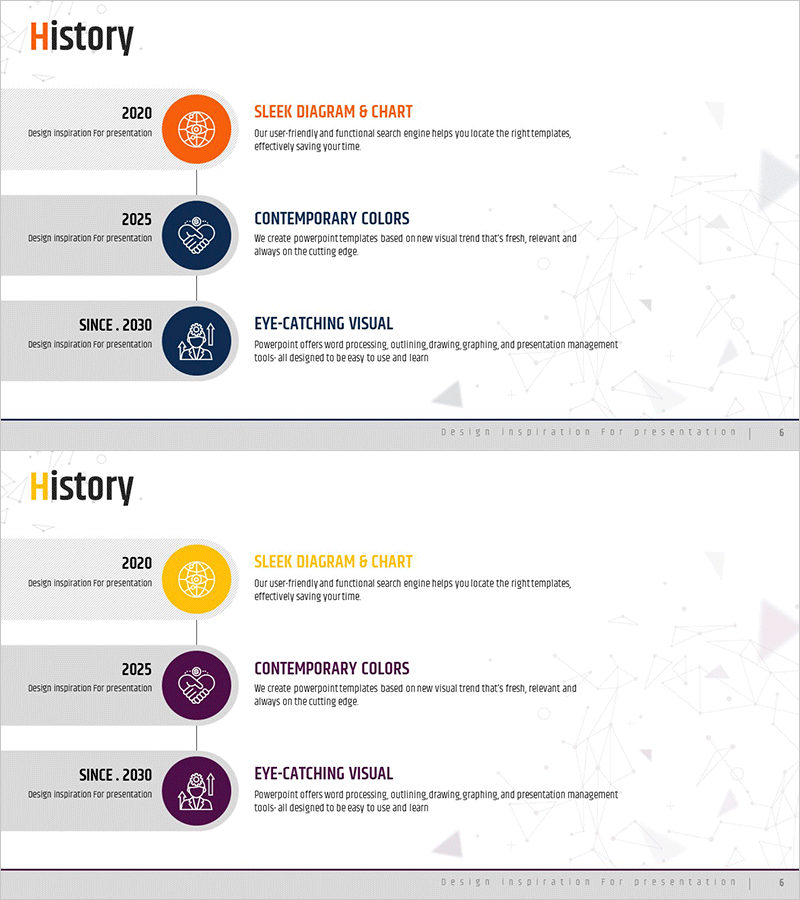
A PowerPoint slide deck featuring a cluster-type timeline diagram designed to visually communicate business history and company milestones. The structure uses circular nodes connected by a vertical timeline, clearly representing key achievements across different periods. Three color schemes—orange, navy blue, and purple—distinguish each phase, while integrated icons and text labels enhance information clarity. Comprising 2 slides optimized for 16:9 widescreen format, this presentation template is ready to use for company introductions, growth narratives, and project progress reports.
Usage Points
-
Main Usage
This slide is optimized for presenting a company's major growth stages and historical milestones in chronological order. Three circular nodes connected by a vertical line create an intuitive visual flow from past to present. Each node accommodates an icon, year, and descriptive text, allowing you to highlight specific achievements and turning points in your organization's journey.
-
How to Use
Use this template for company introductions, corporate history presentations, project status updates, and organizational growth narratives. Customize node colors and icons to emphasize different periods or themes. Expand text areas for detailed descriptions. The 16:9 widescreen format ensures optimal display on large presentation screens and modern projectors.
-
Recommended For
Ideal for executives, marketing professionals, business development teams, investor relations specialists, and HR professionals conducting recruitment presentations. Particularly effective for investor pitch decks, company overview presentations, employee onboarding sessions, and corporate storytelling where growth trajectory is a key message.
-
Slide Structure
2-slide set featuring a vertical timeline with 3 circular nodes connected by a continuous line. Slide 1 displays orange, navy, and purple nodes; Slide 2 offers a color variation with orange, purple, and navy nodes. Each node includes an icon placeholder and text input area. A subtle world map pattern in the background reinforces global business context.
Related Products
-

Portfolio Profile Slide – Company Timeline and Cluster
#Company Introduction #Diagram #History
-

Business History Connection Diagram – Company Growth Story
#Company Introduction #Diagram #History
-

History Flag Shape Diagram - Company Growth and Vision
#Company Introduction #Diagram #History
-

Business History Diagram – Visualizing Organizational Growth
#Company Introduction #Diagram #History
