Business Service Progress Diagram – Efficient Operations Planning
RM0100009_15
- Last Update 01/27/2025
- File Size 0.7MB
- # of Slides 2
- File Format PPTX
- Slide Ratio 16:9
- Color
Keywords
- #Content-Based Slides
- #Design-Based Slides
- #Operational Plan
- #Technical Approach
- #Diagram
- #Business Processes
- #Service Architecture Diagram
- #Flow
- #Cluster
- #Circular Flow
- #16:9
- #circular diagram PowerPoint
- #4-step cycle flow chart
- #business process diagram slide
- #operations planning template
- #cyclical workflow PowerPoint slide
About the Product
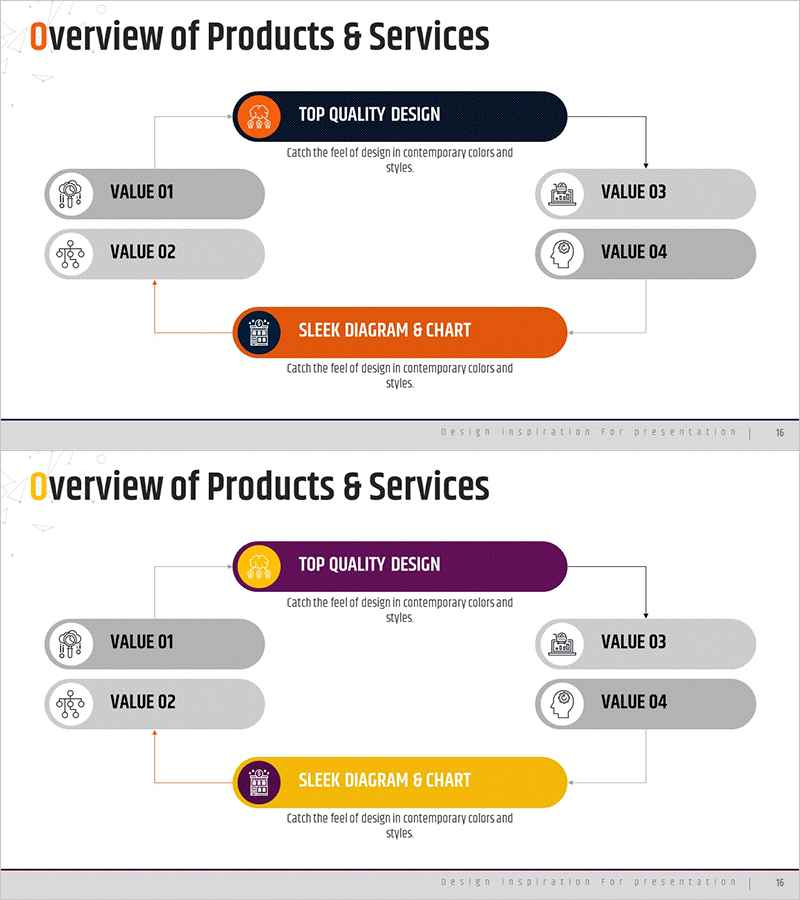
A PowerPoint slide that visualizes business service progress through a 4-node circular structure. The orange and gray color scheme clearly distinguishes each stage, while arrows connecting the central core message to four surrounding VALUE items illustrate the cyclical relationship of operational planning. Delivered in 16:9 widescreen format with 2 slides, ready for immediate editing. Combines icons and text boxes for enhanced information clarity, ideal for technology department presentations, operations planning discussions, and business strategy briefings.
Usage Points
-
Main Usage
Decomposes business service operations into 4 cyclical stages with visual clarity. Each stage displays a VALUE item and connects to the central core message, emphasizing the interconnectedness and continuity of the entire business flow.
-
How to Use
Use in technology department presentations, operations planning explanations, and business strategy meetings to illustrate process flow. Replace node text with your own VALUE items and customize arrow colors and background to match corporate branding.
-
Recommended For
Operations teams, technology departments, business planners, consultants, and project managers explaining cyclical workflows or sustainable business models. Suitable for internal meetings, client presentations, and training seminars.
-
Slide Structure
2-slide set. Each slide features a central orange circular node (core message) surrounded by 4 gray oval text boxes (VALUE 01–04) positioned at cardinal points, connected by circular arrows. Title area at top, page number at bottom.
Related Products
-

Business Process Square Diagram - Clear Strategies and Flow
#Business Vision and Strategy #Operational Plan #Diagram
-

IT Intra Business Process Diagram – Intuitive Representation of Technical Efficiency
#Operational Plan #Technical Approach #Diagram
-

Chemical Lab Presentation Template – Blend of Data Analysis and Visualization
#Product/Service Introduction #Diagram #Composition
-

Learning System Cycle Diagram – Design for Efficient Operational Planning
#Operational Plan #Technical Approach #Diagram
