Balance Sheet Chart by Year – Financial Performance Analysis
RM0100008_31
- Last Update 01/27/2025
- File Size 0.4MB
- # of Slides 2
- File Format PPTX
- Slide Ratio 16:9
- Color
Keywords
- #Content-Based Slides
- #Design-Based Slides
- #Financial Plans and Performance
- #Diagram
- #Balance Sheet
- #Income Statement
- #Table
- #16:9
- #balance sheet PowerPoint slide
- #financial table presentation
- #year-over-year financial comparison slide
- #financial performance analysis PPT
- #balance sheet template PowerPoint
About the Product
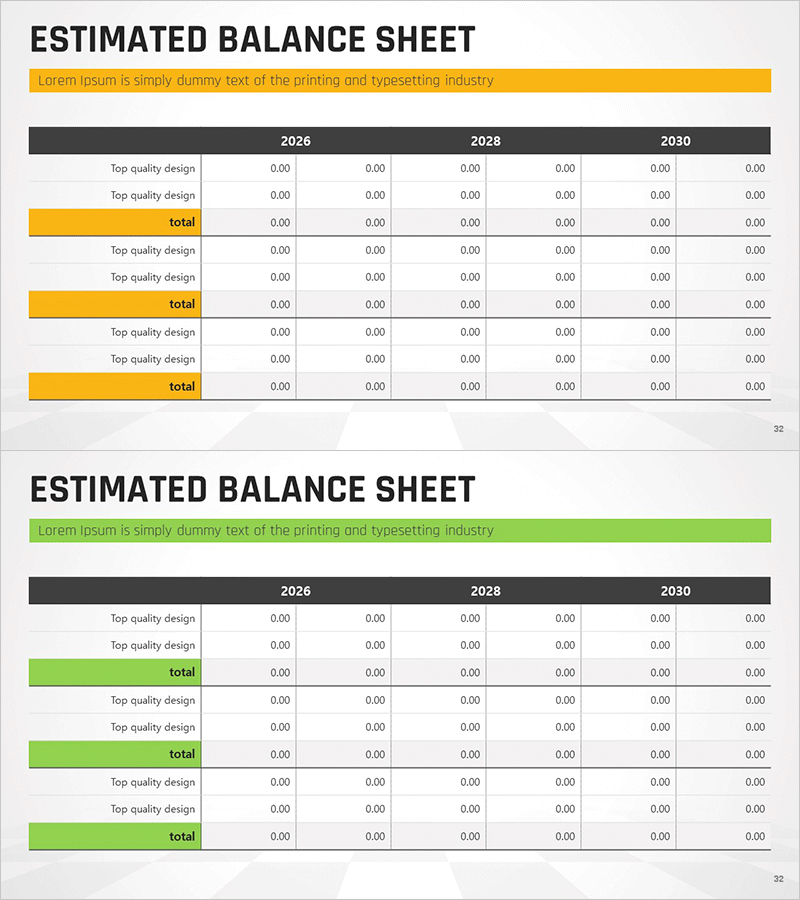
A professional balance sheet PowerPoint slide designed to compare financial data across three years (2026, 2028, 2030) in a clear table format. This presentation slide optimizes financial performance analysis with a dark header row and white background for maximum readability of numerical data. Yellow highlight rows distinguish total line items visually, making key figures stand out. Ideal for investor presentations, financial reports, and business plan decks where credibility and data clarity are essential.
Usage Points
-
Main Usage
Presents corporate financial status through year-over-year comparison, demonstrating financial credibility to investors and stakeholders. The table format enables intuitive numerical comparison and serves as a core slide in the financial performance analysis section of presentations.
-
How to Use
Insert into IR materials, financial reports, or business plan presentations within the financial section to explain year-over-year financial performance. Replace table values with actual data for immediate use in presentations. Yellow highlight rows emphasize total line items and key financial metrics.
-
Recommended For
CFOs, financial managers, investor relations professionals, accountants, and executives presenting financial results. Particularly suitable for public company disclosures, investment pitch decks, shareholder meeting materials, and documents where financial accuracy and credibility are paramount.
-
Slide Structure
Two-slide deck with each slide containing one title area and one financial data table. Tables feature 8-10 rows (financial line items) and 6 columns (two values per year). Dark header row and yellow highlight total rows create clear information hierarchy and visual distinction.
Related Products
-

Visualizing Financial Status with Balance Sheet Table
#Financial Plans and Performance #Diagram #Balance Sheet
-

Yellow Green Income Statement Table – Efficient Financial Analysis
#Financial Plans and Performance #Diagram #Balance Sheet
-

Asset & Liability Calculation Table – Optimized for Financial Management
#Financial Plans and Performance #Diagram #Balance Sheet
-

Blue Pink Balance Sheet Slide – Essential for Financial Performance
#Financial Plans and Performance #Diagram #Balance Sheet
