Balance Sheet Analysis Table – Visualize Financial Performance
RM0100007_31
- Last Update 01/26/2025
- File Size 0.4MB
- # of Slides 2
- File Format PPTX
- Slide Ratio 16:9
- Color
Keywords
- #Content-Based Slides
- #Design-Based Slides
- #Financial Plans and Performance
- #Diagram
- #Balance Sheet
- #Income Statement
- #Table
- #16:9
- #balance sheet PowerPoint slide
- #financial data table template
- #financial analysis presentation
- #how to create a balance sheet in PowerPoint
- #multi-year financial comparison slide
About the Product
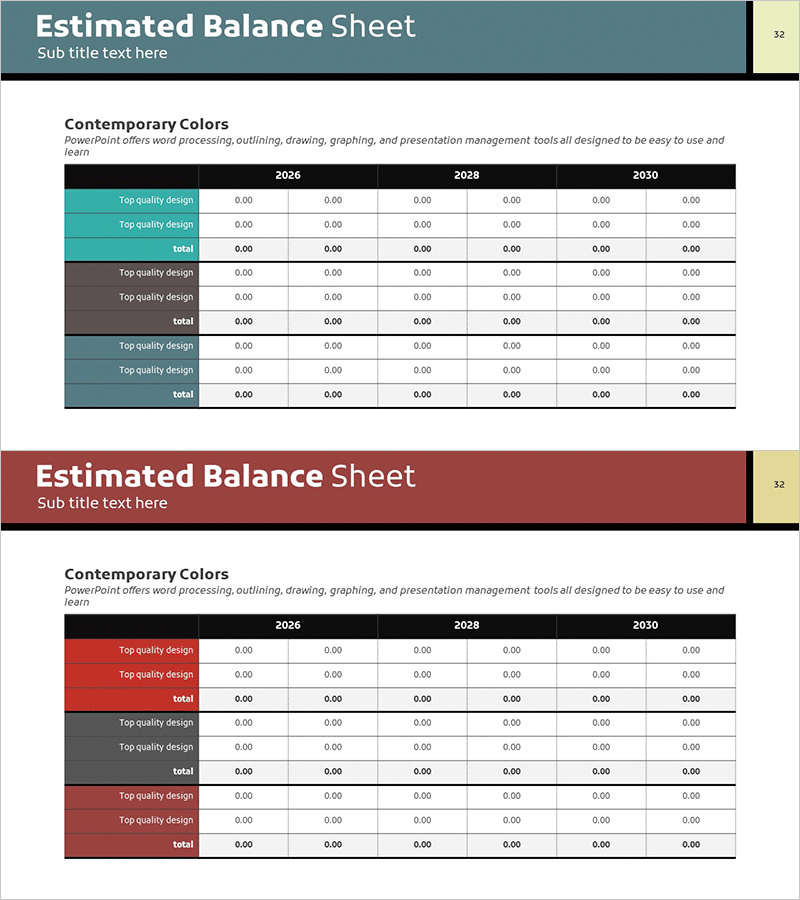
A financial data table PowerPoint slide that clearly visualizes balance sheet performance across three years (2026, 2028, 2030). Designed for investor presentations and financial reports, this slide enables quick comparison of assets, liabilities, and equity. Two color versions—teal and burgundy—are provided to match your corporate branding. The table layout features clearly defined rows and columns, making complex financial information easy to understand at a glance. Optimized for 16:9 widescreen format with 2 slides total, offering ample space for entering various financial line items and numerical data.
Usage Points
-
Main Usage
This slide presents financial performance, assets, liabilities, and equity in a data-driven format. The year-over-year comparison allows stakeholders to quickly assess financial trends, making it ideal for investor pitches, board meetings, and executive financial reviews where credibility and clarity are essential.
-
How to Use
Simply enter your actual financial figures into the table cells. Row labels (assets, liabilities, equity, etc.) and column headers (years) are pre-configured, so you only need to input your data. Choose the color version that best matches your corporate identity or presentation theme.
-
Recommended For
Finance teams, investor relations departments, and executives presenting quarterly or annual financial results. Perfect for business plans, investment pitch decks, financial reports, and management analysis documents. Especially effective when multi-year trend analysis is required to demonstrate financial growth or stability.
-
Slide Structure
Two slides featuring multi-row, multi-column tables displaying data for three years (2026, 2028, 2030). The header row contains years, the left column lists financial categories (assets, liabilities, equity, etc.), and data entry cells are positioned at row-column intersections. Color variants provide visual flexibility for different presentation contexts.
Related Products
-

Yellow Green Income Statement Table – Efficient Financial Analysis
#Financial Plans and Performance #Diagram #Balance Sheet
-

Last Year's Sales Comparison Analysis Table – Visually Representing Financial Performance
#Financial Plans and Performance #Diagram #Balance Sheet
-

Asset & Liability Calculation Table – Optimized for Financial Management
#Financial Plans and Performance #Diagram #Balance Sheet
-

Diagram Table Slide for Financial Performance Analysis
#Financial Plans and Performance #Diagram #Balance Sheet
