Comparative Analysis Graph by Year – Clearly Presenting Financial Results
RM0100006_32
- Last Update 01/26/2025
- File Size 0.3MB
- # of Slides 2
- File Format PPTX
- Slide Ratio 16:9
- Color
Keywords
- #Content-Based Slides
- #Design-Based Slides
- #Financial Plans and Performance
- #Diagram
- #Sales and Revenue
- #Key Financial Indicators
- #Table
- #16:9
- #year-over-year comparison table PPT
- #financial data PowerPoint slide
- #4-year comparison table
- #financial performance analysis slide
- #how to create financial comparison in PowerPoint
About the Product
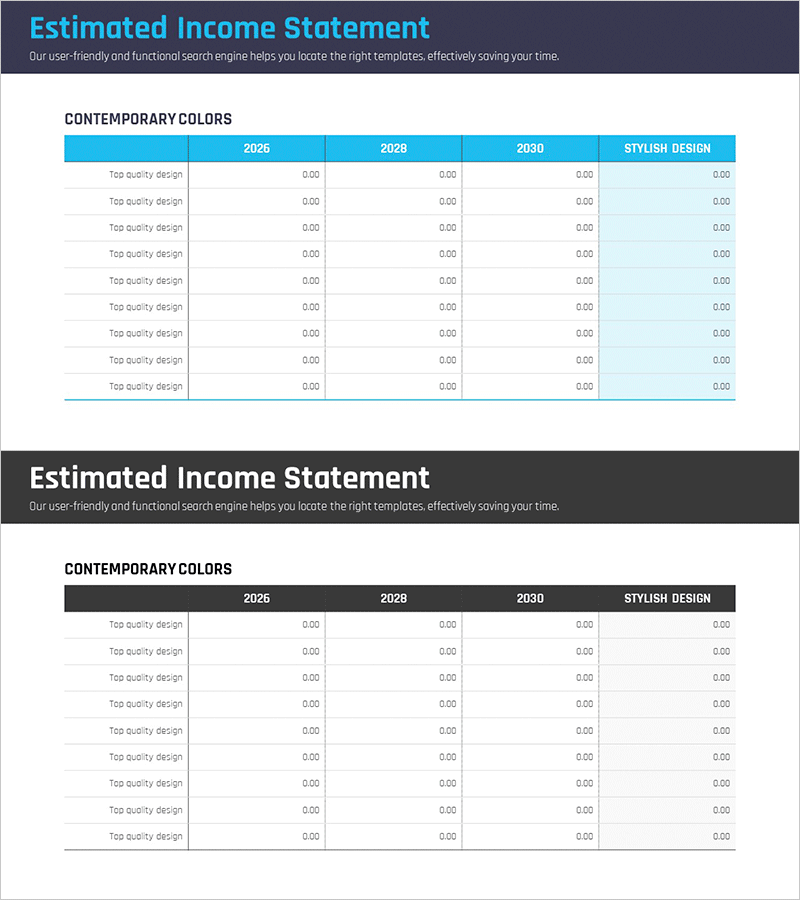
A PowerPoint slide designed to clearly compare and analyze financial performance across multiple years. Featuring a light gray background with a cyan blue header, this table layout displays financial metrics from 2026 through 2030 in a horizontal format. The slide includes 9 rows for data entry and 4 year columns, with an additional 'Stylish Design' column for supplementary information. Ideal for investor presentations, IR materials, and business reports where financial figures need to be visualized effectively in a professional presentation format.
Usage Points
-
Main Usage
Display financial indicators, revenue, expenses, and profit figures in tabular format to compare year-over-year performance trends. This slide communicates financial credibility and growth trajectory to investors, executives, and stakeholders.
-
How to Use
Insert this slide in the financial section of business plans, investment pitch decks, or annual performance reports. Enter line item names (revenue, operating profit, net income, etc.) in the left column and corresponding year values in each column to visualize financial progression.
-
Recommended For
CFOs, financial managers, and executives presenting financial performance to investors, shareholders, and employees. Particularly effective for multi-year financial planning, budget presentations, and performance evaluation meetings.
-
Slide Structure
Cyan blue header row with 4 year columns (2026, 2028, 2030, Stylish Design). Nine data rows below with financial item descriptions and numeric input fields for each year. Light gray background with blue header contrast ensures optimal data readability and visual hierarchy.
Related Products
-

Key Financial Indicators by Sector – Concise and Stylish Design
#Financial Plans and Performance #Diagram #Sales and Revenue
-

Capital Sales Analysis Graph – Visualizing Financial Performance
#Financial Plans and Performance #Diagram #Graph
-

Sales and Profit Table – Statistical Financial Performance
#Financial Plans and Performance #Diagram #Sales and Revenue
-

Colors Theme Presentation Template Table – Financial Planning and Performance
#Financial Plans and Performance #Diagram #Sales and Revenue
