Balance Sheet Table Chart – Key to Financial Planning
RM0100006_31
- Last Update 01/26/2025
- File Size 0.3MB
- # of Slides 2
- File Format PPTX
- Slide Ratio 16:9
- Color
Keywords
About the Product
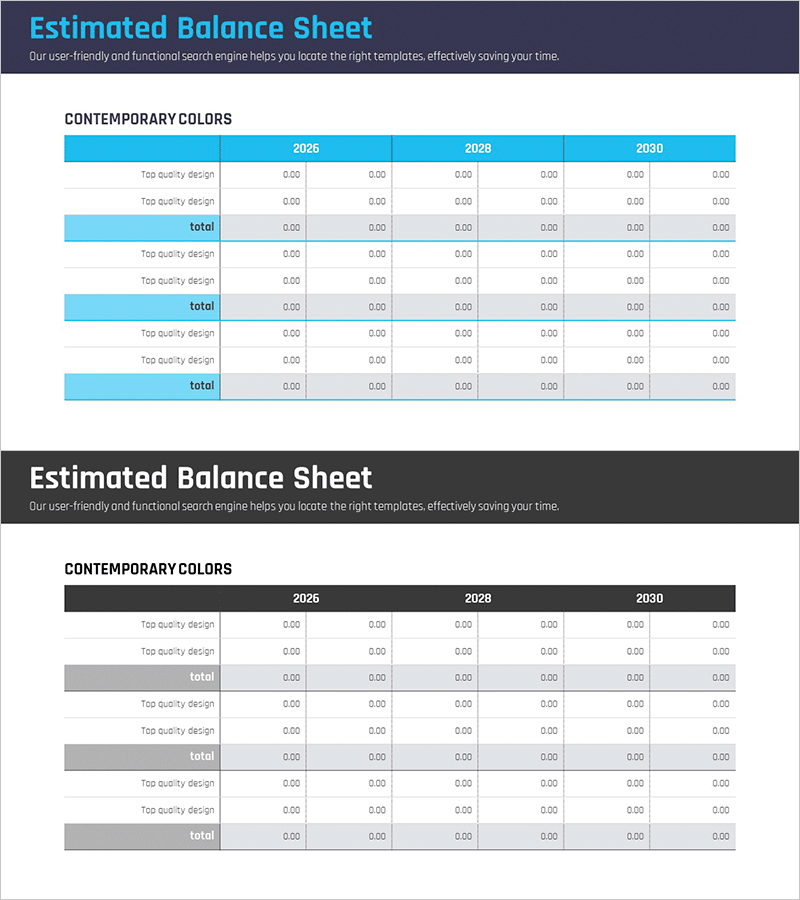
An essential balance sheet PowerPoint slide for financial planning and investment pitch presentations. Designed as a table format comparing financial data across three years from 2026 to 2030, with clear separation of assets, liabilities, and equity items. The layout features a bright blue header and gray accent rows to express information hierarchy, with ample numerical input areas for immediate use. This 16:9 widescreen 2-slide set effectively communicates financial status analysis and future projections to stakeholders.
Usage Points
-
Main Usage
Systematically visualizes a company's financial position to communicate reliable financial information to investors, financial institutions, and executives. Clearly presents the balance sheet structure of assets, liabilities, and equity in table format to maximize financial readability.
-
How to Use
Use in the financial overview section of business plans, investment pitch decks, and financial reports. Input actual financial data into the numerical fields and emphasize financial growth through year-over-year comparisons. Enhances audience understanding of financial performance during presentations.
-
Recommended For
CFOs, finance managers, executives, and investor relations professionals explaining financial status. Essential for startup investment pitches, quarterly and annual financial reports, and bank loan application materials.
-
Slide Structure
Comprises 2 slides, each containing a balance sheet table with data for 3 years (2026, 2028, 2030). The header row displays years, the left column lists items (assets, liabilities, equity), and the right side provides numerical input areas. Total rows are highlighted in blue to clearly establish information hierarchy.
Related Products
-

Income Statement Table Chart – Overview of Financial Planning and Performance
#Financial Plans and Performance #Diagram #Balance Sheet
-

Emphasizing Key Row in Table – Essential Tool for Financial Management
#Financial Plans and Performance #Diagram #Balance Sheet
-

Visualizing Financial Status with Balance Sheet Table
#Financial Plans and Performance #Diagram #Balance Sheet
-

Corporate Financial Evaluation Analysis Balance Sheet – Data Visualization
#Financial Plans and Performance #Diagram #Balance Sheet
