Business Components Gradient Diagram – Relationships and Connections
RM0100005_17
- Last Update 01/25/2025
- File Size 0.3MB
- # of Slides 2
- File Format PPTX
- Slide Ratio 16:9
- Color
Keywords
- #Content-Based Slides
- #Design-Based Slides
- #Product/Service Introduction
- #Diagram
- #Composition
- #Cluster
- #Spread
- #Chain Diagram
- #Centralized Diagram
- #16:9
- #radial diagram PowerPoint
- #central node diagram slide
- #business relationship map PPT
- #gradient diagram template
- #organizational structure PowerPoint
- #network diagram slide download
About the Product
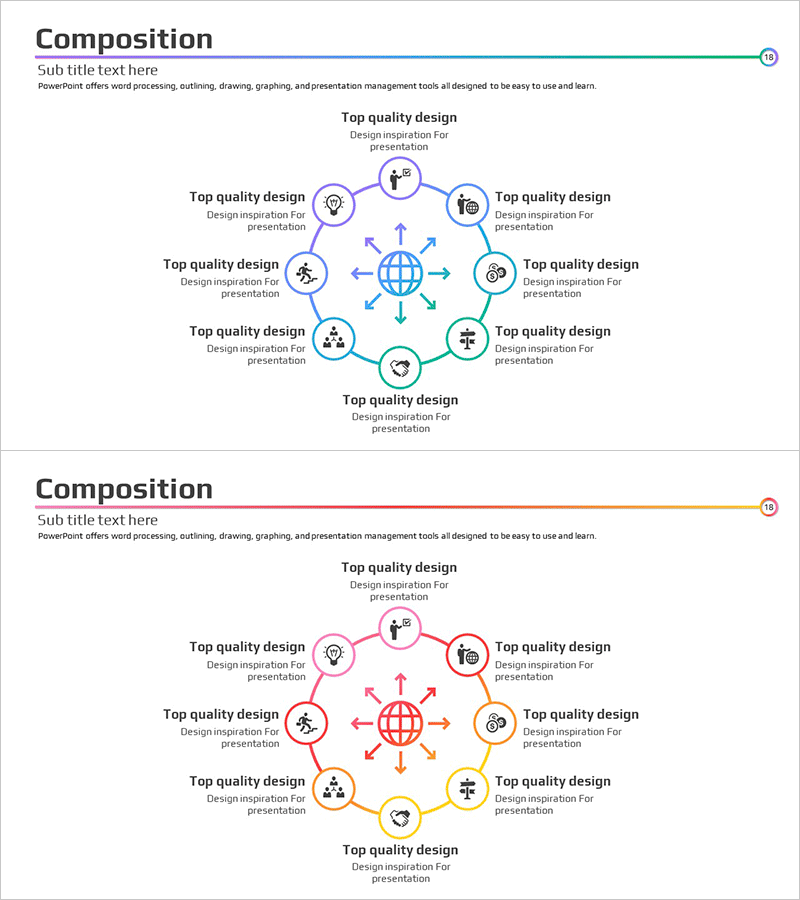
A PowerPoint slide featuring a radial diagram with a central globe icon surrounded by 8 relationship nodes arranged in a circular pattern. Blue, purple, green, and orange gradient colors are applied to each node, visually representing connections and interactions between business components. Bidirectional arrows emphasize mutual relationships, and each node includes icons and text areas for customization. Ideal for organizational structures, stakeholder maps, process networks, and ecosystem visualizations in presentations. Delivered in editable PPTX format with 16:9 widescreen ratio across 2 slides.
Usage Points
-
Main Usage
Designed to clearly express mutual relationships between departments, teams, and roles within an organization from a central focal point. Effectively visualizes stakeholder maps, business ecosystems, process networks, and global structures that radiate outward from a core concept.
-
How to Use
Set the central globe icon as your core concept (company, project, or strategy) and populate the 8 surrounding nodes with related elements (departments, teams, functions, regions, or stakeholders). Edit node text and icons to match your presentation context. Bidirectional arrows highlight two-way interactions and feedback loops.
-
Recommended For
Executive reports, organizational restructuring announcements, business partnership introductions, global expansion strategies, stakeholder communications, and project governance structures. Particularly valuable in consulting, finance, IT, and manufacturing industries where complex relationship structures require clear visualization.
-
Slide Structure
2-slide set with the first slide featuring blue and purple gradient nodes and the second slide displaying green and orange gradient nodes in the same radial configuration. Each node contains a circular background with icon and text input area, connected to the central globe icon via bidirectional arrows extending to all 8 positions.
Related Products
-

Maple Leaf Distribution and Promotion Strategy Diagram – Maximizing Business Impact with Clusters
#Product/Service Introduction #Diagram #Product/Service Introduction
-

Dinosaur Feature Diagram
#Product/Service Introduction #Technical Approach #Diagram
-

Subject Learning Elements Diagram – Visualizing Business Regions and Structure
#Product/Service Introduction #Business Introduction #Diagram
-

Vibrant Color Box PPT Composition Contents
#Product/Service Introduction #Technical Approach #Diagram
