Visualizing Market Analysis Status with Charts
RM0100005_11
- Last Update 01/25/2025
- File Size 0.3MB
- # of Slides 2
- File Format PPTX
- Slide Ratio 16:9
- Color
Keywords
About the Product
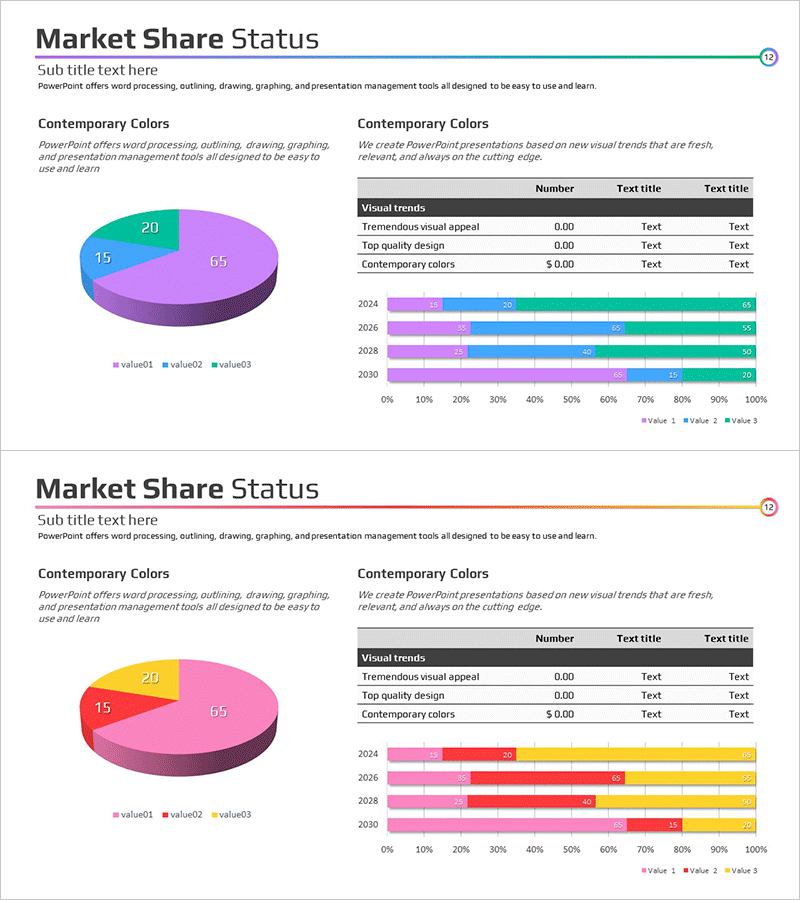
A 2-slide PowerPoint presentation designed for market analysis and status visualization. This slide deck combines a pie chart and horizontal bar graph to display market share ratios and year-over-year trends intuitively. Four color series—teal, purple, pink, and yellow—distinguish data categories, while year-by-year comparisons from 2024 to 2030 provide clear trend analysis. Includes data table and legend for accurate numerical communication. Ready to use in business presentations, reports, and strategic planning decks.
Usage Points
-
Main Usage
Designed to present market share ratios and annual trends at a glance by combining pie and horizontal bar charts. Quantitative data is distinguished by color series to enhance audience comprehension and deliver market analysis findings persuasively.
-
How to Use
Slide 1 displays current market share proportions via pie chart. Slide 2 compares year-over-year trends using horizontal bar graph. Legend and numerical labels ensure accurate data communication. All colors and data points are fully editable to match your specific metrics.
-
Recommended For
Ideal for executive reports, investor presentations, business plans, marketing strategies, and quarterly performance reviews. Suitable for market researchers, strategic planners, sales managers, and financial analysts presenting data-driven insights and competitive positioning.
-
Slide Structure
Slide 1: 3-segment pie chart (value01, value02, value03) + legend + title and subtitle areas. Slide 2: 4-year horizontal bar graph (2024, 2026, 2028, 2030) with 3 data series + legend + information table (Visual trends, Tremendous visual appeal, Top quality design, Contemporary colors) + title and subtitle areas.
Related Products
-

Market Analysis Segmented Vertical Bar Graph – Target Market Analysis
#Market and Competitor Analysis #Graph #Market Analysis
-

Market Share Analysis with Donut Chart – Essential for Marketing Goals
#Market and Competitor Analysis #Marketing Plan and Strategy #Graph
-

Medical Illustration Customer Analysis Silhouette Graph – Visualizing Customer Psychology
#Market and Competitor Analysis #Graph #Other
-

Pie Chart by User – Customer Analysis and Market Share
#Market and Competitor Analysis #Graph #Customer Analysis
