Eco-friendly Indicator Table – Sustainable Business Strategy
RJ0600022_10
- Last Update 06/26/2025
- File Size 2MB
- # of Slides 2
- File Format PPTX
- Slide Ratio 16:9
- Color
Keywords
- #Content-Based Slides
- #Design-Based Slides
- #Business Strategy
- #Business Management
- #Diagram
- #Achievements
- #Reporting and Review Plan
- #Table
- #Standard Table
- #16:9
- #eco-friendly indicator table PowerPoint
- #sustainability metrics slide
- #ESG performance template
- #environmental data table
- #business strategy presentation
About the Product
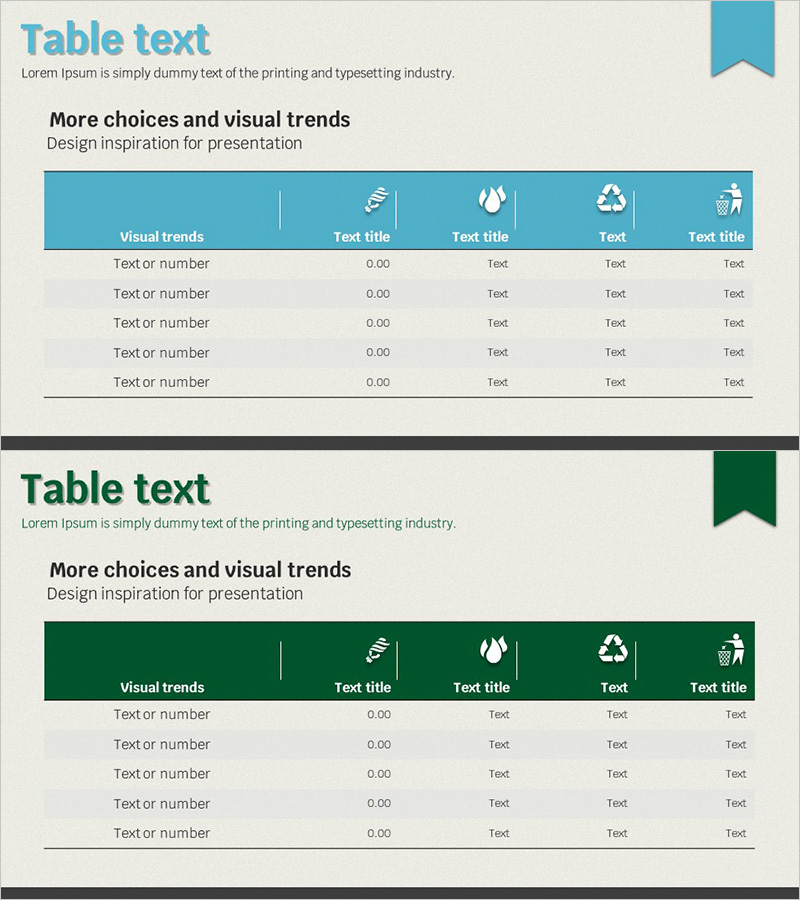
A sustainable business strategy table PowerPoint slide featuring eco-friendly indicators with a teal header and environmental icons (water droplet, recycling, trash bin). The 5-row 6-column structure organizes indicator names, numerical values, and descriptions for clear comparison of ESG metrics, carbon neutrality targets, and environmental performance data. Two-slide set includes teal and forest green color versions, optimized for 16:9 widescreen presentations. Fully editable PPTX format allows instant data entry and customization for corporate sustainability reports, environmental policy briefings, and stakeholder communications.
Usage Points
-
Main Usage
Systematically organize and compare corporate environmental indicators, performance metrics, and sustainability targets. Supports sustainability reports, ESG management presentations, environmental policy briefings, carbon neutrality progress updates, and stakeholder communications where numerical data and environmental goals must be clearly presented.
-
How to Use
Select teal or forest green header version matching corporate branding. Enter environmental indicator names (water consumption, energy use, waste reduction, etc.), numerical values, targets, and achievement rates into table cells. Header icons (water droplet, recycling, trash bin) visually categorize data; customize colors and icons as needed for brand alignment.
-
Recommended For
Sustainability officers, environmental management teams, CSR departments, and executives presenting environmental performance metrics. Ideal for investor presentations, government reporting, internal management meetings, and client presentations requiring credible quantitative environmental data visualization.
-
Slide Structure
Two-slide set with teal version (top) and forest green version (bottom). Each slide features a 5-row 6-column table with header row containing 5 environmental icons and text titles, followed by 5 data rows for indicator names, values, and descriptions. 16:9 widescreen format optimized for modern projectors and display environments.
Related Products
-

Mint Yellow Table Slide – An Efficient Tool for Business Management
#Product/Service Introduction #Business Management #Diagram
-

Financial Performance and Forecast – Diagram for Business Strategy
#Business Strategy #Financial Plans and Performance #Diagram
-

Match Illustration Bar Chart – Performance and Market Analysis
#Business Strategy #Market and Competitor Analysis #Diagram
-

Summary Table of Experimental Data – Precise Information Delivery
#Business Strategy #Technical Approach #Diagram
