Marketing KPI Framework Slide for Goal Setting and Performance Analysis
RM0400018_5
- Last Update 01/26/2026
- File Size 12.1MB
- # of Slides 2
- File Format PPTX
- Slide Ratio 16:9
- Color
Keywords
About the Product
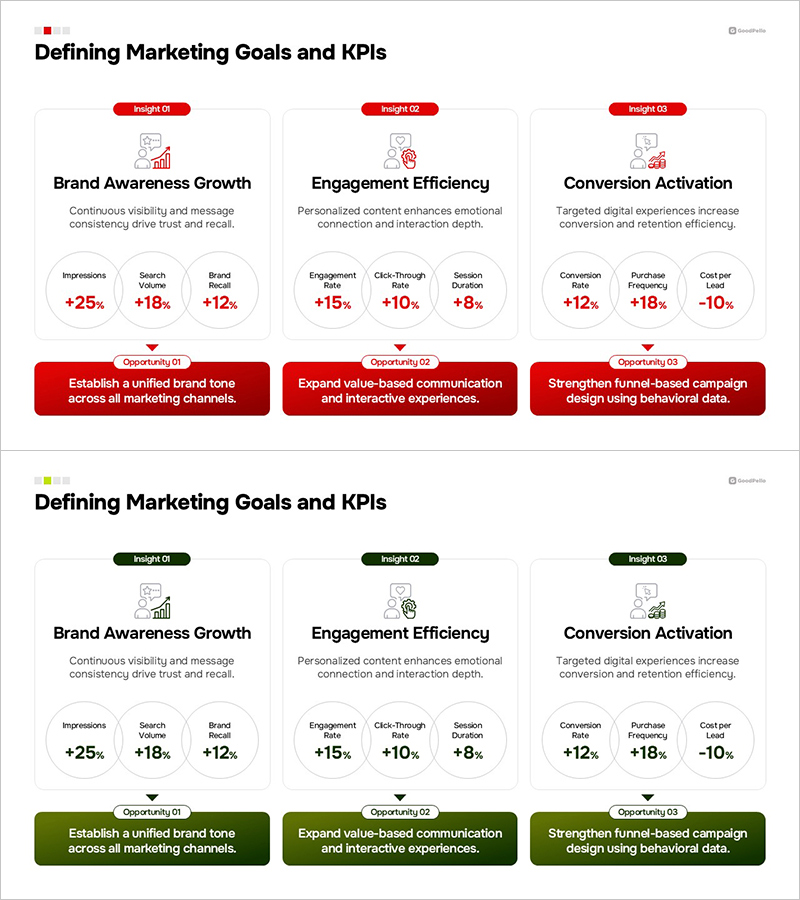
A 2-slide PowerPoint presentation for defining marketing goals and analyzing key performance indicators (KPIs). This deck visually compares three core marketing metrics: Brand Awareness Growth, Engagement Efficiency, and Conversion Activation. Each metric displays specific performance data (+25%, +18%, +12%, etc.) and actionable opportunities at a glance. Available in two color schemes (red and green), the slides use icons, circular charts, and structured text boxes to create clear information hierarchy and support strategic decision-making. Ideal for marketing strategy planning sessions, quarterly performance reviews, and executive presentations on marketing performance.
Usage Points
-
Main Usage
Define and communicate your organization's key marketing performance indicators (KPIs) to stakeholders, teams, and executives. This slide framework simultaneously visualizes three critical marketing objectives—brand awareness growth, engagement efficiency, and conversion activation—enabling data-driven strategic planning and performance accountability.
-
How to Use
Use these slides in marketing strategy workshops, quarterly business reviews, executive performance dashboards, and marketing team alignment meetings. Customize the metric values, percentages, and opportunity statements to reflect your organization's actual KPI targets and recent performance data for immediate relevance.
-
Recommended For
Marketing managers, marketing directors, CMOs, business development leaders, and performance analysts responsible for setting and tracking marketing goals. Particularly valuable for digital marketing teams, brand marketing departments, and performance marketing organizations conducting quarterly or annual goal-setting and performance reporting.
-
Slide Structure
Two slides, each containing three independent KPI sections (Insight 01, 02, 03). Each section includes a metric title, descriptive text, icon, three circular performance charts with percentage values, and an actionable opportunity statement in a colored box. The clear visual hierarchy makes complex marketing metrics accessible and actionable for diverse audiences.
Related Products
-

Marketing Objectives and Key Metrics - Enhancing Business Performance
#Business Strategy #Marketing Plan and Strategy #Diagram
-

Current Accomplished Numerical Graph – Diagram Visualizing Achievements
#Business Strategy #Marketing Plan and Strategy #Diagram
-

Horizontal Bar Chart for Performance Visualization – Driving Business Momentum
#Business Strategy #Marketing Plan and Strategy #Graph
-

Visualizing Marketing Goals and Prospects – Opportunities for Success
#Business Strategy #Marketing Plan and Strategy #Graph
