User Market Analysis Graph
RM0100004_13
- Last Update 01/25/2025
- File Size 3.4MB
- # of Slides 2
- File Format PPTX
- Slide Ratio 16:9
- Color
Keywords
- #Content-Based Slides
- #Design-Based Slides
- #Market and Competitor Analysis
- #Graph
- #Market Analysis
- #Horizontal Bar
- #Horizontal Bar Chart
- #16:9
- #bar chart PowerPoint
- #customer analysis slides
- #market analysis presentation
- #data comparison graph
- #horizontal vertical bar chart
- #PowerPoint graph template download
About the Product
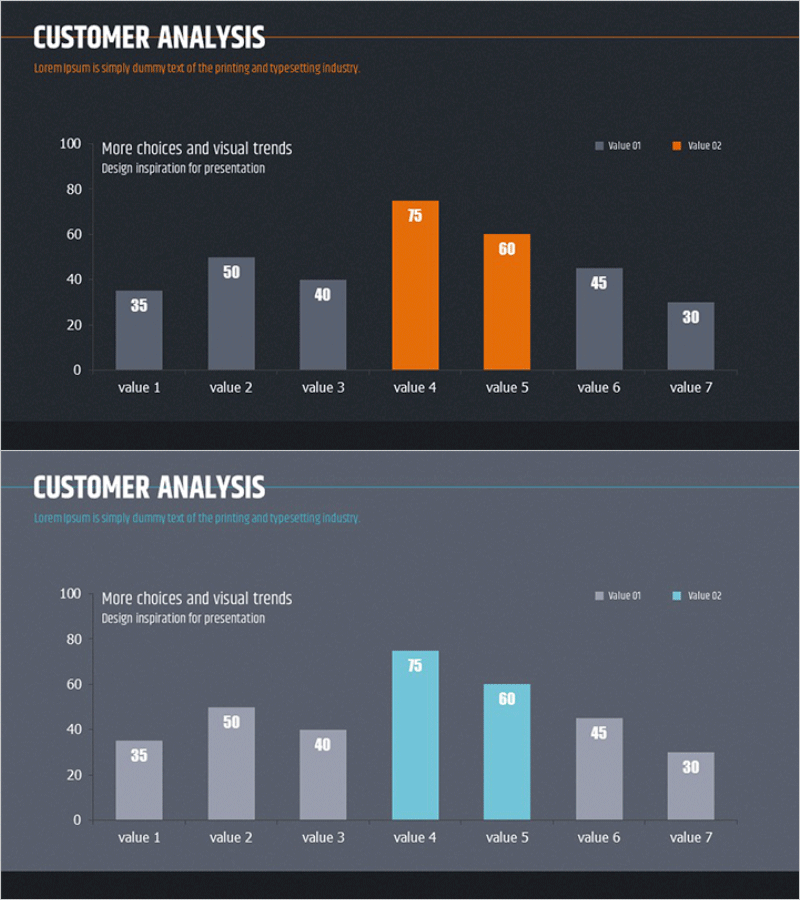
A 2-slide PowerPoint set designed for market analysis and customer analysis presentations. This template provides both horizontal and vertical bar charts, allowing you to select the chart type that best fits your data comparison scenario. The dark background with orange and light blue accent colors highlights key data points across 7 items with clear numerical representation. Ideal for business presentations, reports, and strategic planning documents where quantitative data on customer segmentation, market share, performance metrics, and comparative analysis need to be communicated effectively to stakeholders.
Usage Points
-
Main Usage
Visually represent quantitative data for market analysis, customer segmentation, and performance comparison. The dual chart format—horizontal and vertical bar graphs—allows you to present 7 data points with 2 value series simultaneously, enhancing comparative analysis and audience comprehension during presentations.
-
How to Use
Slide 1 displays a horizontal bar chart for sequential item-by-item numerical comparison. Slide 2 shows a vertical bar chart emphasizing trends and comparative relationships. Simply edit the numerical values and labels on each slide to input your actual data for immediate use. The orange and light blue accent colors can be customized to match your corporate brand identity.
-
Recommended For
Ideal for marketing, sales, and planning departments presenting market conditions, executive reports, and quarterly performance analysis. Suitable for customer segmentation, regional or product-based sales comparisons, competitive analysis, and other business data visualization needs across various industries.
-
Slide Structure
Slide 1: Horizontal bar chart with 7 items, 2 data series (Value 01, Value 02), 0–100 scale. Slide 2: Vertical bar chart with identical 7 items and 2 series on same scale. Dark background with orange and light blue highlights, white text and numerical labels throughout.
Related Products
-

Space Industry Analysis Graph Chart – Market and Competitive Analysis
#Market and Competitor Analysis #Graph #Customer Analysis
-

Horizontal Bar Chart for Learning Method Survey Analysis – Strategic Approach
#Market and Competitor Analysis #Marketing Plan and Strategy #Graph
-

Fire Dispatch Graph – Market Analysis and Competitive Advantage
#Market and Competitor Analysis #Graph #Market Analysis
-

User Gender Ratio Analysis – Market Insights
#Market and Competitor Analysis #Graph #Customer Analysis
