Distribution Strategy Circular Diagram – Simple Visual for Marketing Strategy
RM0100003_27
- Last Update 01/25/2025
- File Size 2.4MB
- # of Slides 2
- File Format PPTX
- Slide Ratio 16:9
- Color
Keywords
- #Content-Based Slides
- #Design-Based Slides
- #Technical Approach
- #Marketing Plan and Strategy
- #Diagram
- #System Architecture Diagram
- #Distribution Strategy
- #Flow
- #Circular Flow
- #16:9
- #circular diagram PowerPoint
- #3-step cycle slide
- #distribution strategy presentation
- #marketing process diagram
- #how to create circular flow in PowerPoint
- #business cycle template download
About the Product
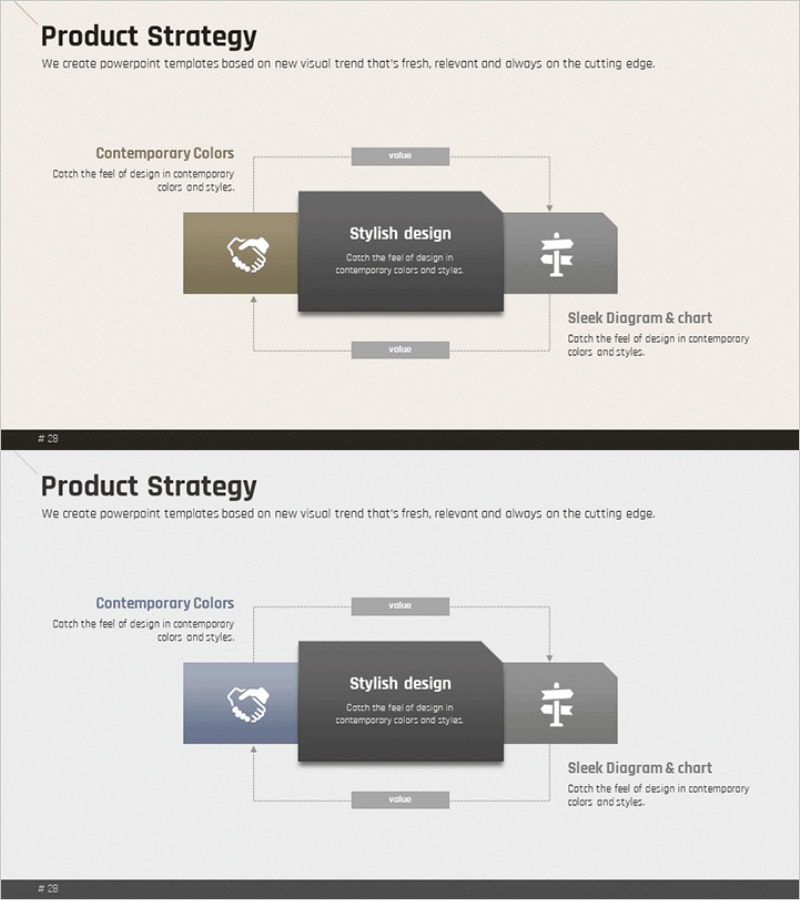
A PowerPoint slide that visualizes distribution strategy and marketing processes using a 3-step circular structure. The central dark gray box holds your core message, while hexagonal nodes in olive and gray tones on both sides accommodate stage-specific strategies. Arrows and connecting lines clarify the cyclical flow, with icons (handshake and cross) symbolizing collaboration and value creation. Formatted in 16:9 PPTX with 2 slides, this presentation material is ready to edit immediately.
Usage Points
-
Main Usage
Optimized for visualizing distribution channel strategy, marketing cycles, and business process flows in a 3-step circular structure. Clearly communicates the interaction between elements and iterative improvement processes during strategy development.
-
How to Use
Enter your core strategy name in the central dark gray box and fill in stage-specific strategies in the left and right hexagonal nodes. Keep the icons and arrows intact to emphasize the cyclical flow connection. Colors and text can be freely modified to match your corporate brand.
-
Recommended For
Ideal for marketing managers, strategy planning teams, and sales directors explaining distribution channels, customer journey maps, and business cycles. Effective in executive briefings, team meetings, and client proposal presentations where emphasizing process circularity is key.
-
Slide Structure
2-slide set featuring 3 nodes per slide (left olive hexagon, center dark gray box, right gray hexagon) connected by top and bottom arrows and linking lines. Data flow between nodes is expressed through directional arrows, with 2 icons (handshake and cross) symbolizing collaboration and value.
Related Products
-

Business Process Pentagon 3D Diagram – Visualizing Operational Plans
#Operational Plan #Technical Approach #Diagram
-

Mobile Service System Configuration Diagram - Technical Concept Introduction
#Product/Service Introduction #Technical Approach #Diagram
-

Circular Diagram Slide for Product/Service Differentiation Strategy
#Product/Service Introduction #Technical Approach #Diagram
-

Interior Template Circulation Diagram - Target Market Strategy
#Marketing Plan and Strategy #Diagram #Target Market Strategy
