Positioning Analysis Graph – Optimized for Market Analysis
RM0100003_25
- Last Update 01/25/2025
- File Size 2.4MB
- # of Slides 2
- File Format PPTX
- Slide Ratio 16:9
- Color
Keywords
- #Content-Based Slides
- #Design-Based Slides
- #Market and Competitor Analysis
- #Marketing Plan and Strategy
- #Graph
- #Other
- #Market Analysis
- #Positioning
- #16:9
- #positioning analysis PPT slide
- #positioning map PowerPoint
- #2-axis comparison chart slide
- #market analysis positioning PPT
- #competitive analysis graph slide
About the Product
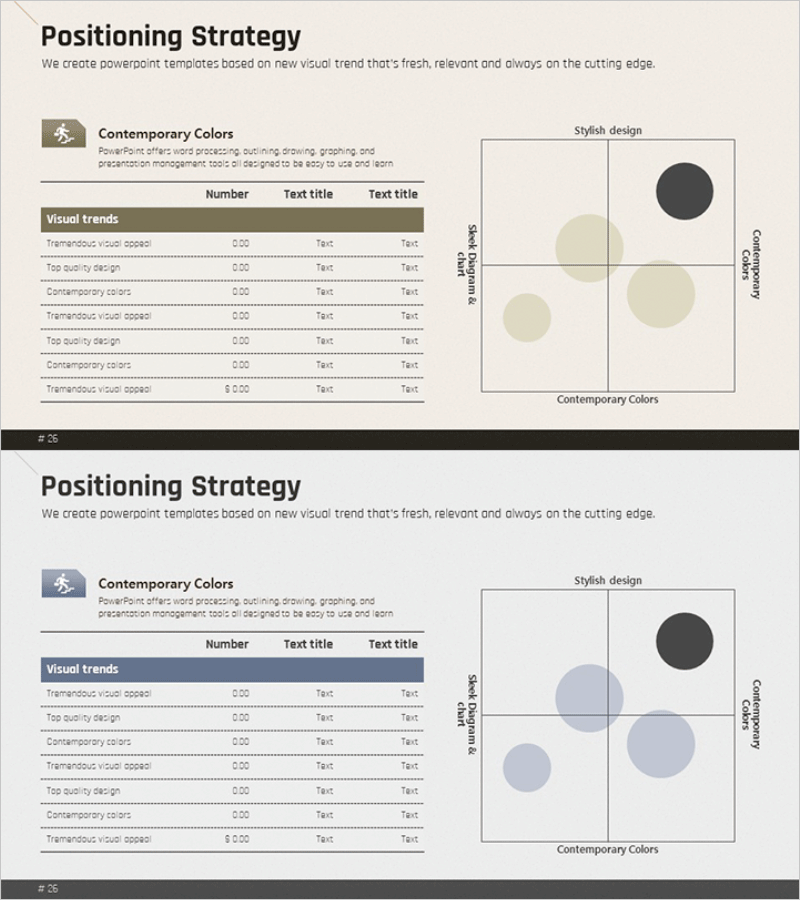
An essential PowerPoint slide for market analysis and competitive strategy development. This 2-slide set features a minimalist layout with beige, cream, and charcoal tones on the first slide, displaying a 4-quadrant positioning map, and a blue-toned header on the second slide with an identical comparison chart structure. Each slide includes 3 text input areas and 4 circular data points to intuitively represent market segmentation, competitor positioning, and company positioning analysis. Immediately applicable to presentations, marketing plans, and business proposals.
Usage Points
-
Main Usage
A slide for comparing your company's and competitors' positioning across two axes (e.g., price-quality, functionality-usability) during market analysis. Clearly communicates your company's market position and differentiation strategy to investors, executives, and marketing teams.
-
How to Use
Place competitor and company positions as circular data points on the 4-quadrant map in the first slide, and enter characteristics of each quadrant in text areas. Use the second slide to compare positioning across different axes or represent positioning changes over time.
-
Recommended For
Ideal for marketing plans, business proposals, investor pitch decks, executive reports, and new product launch strategy presentations. Particularly effective when visually presenting decision-making evidence in market segmentation, competitive analysis, and positioning strategy sections.
-
Slide Structure
2-slide composition. Each slide contains 1 title area, 1 descriptive text area, 1 two-axis coordinate system, 4 circular data points, and 1 legend area. Optimized for 16:9 widescreen format and can be reused for multiple analysis scenarios by changing color tones (beige and blue).
Related Products
-

Positioning Diagram – Market Analysis and Strategy
#Market and Competitor Analysis #Marketing Plan and Strategy #Graph
-

Strategic Positioning Map – Market Analysis and Marketing Strategy
#Market and Competitor Analysis #Marketing Plan and Strategy #Diagram
-

Space Industry Positioning Map - Visualizing Market Competitiveness
#Market and Competitor Analysis #Marketing Plan and Strategy #Graph
-

Clothing Market Positioning Map – Strategic Analysis
#Market and Competitor Analysis #Marketing Plan and Strategy #Diagram
