Analysis of the Gender Ratio of Users of Self-Driving Services – Market Analysis and Customer Insight
RJ0400042_19
- Last Update 08/30/2025
- File Size 2MB
- # of Slides 2
- File Format PPTX
- Slide Ratio 16:9
- Color
Keywords
About the Product
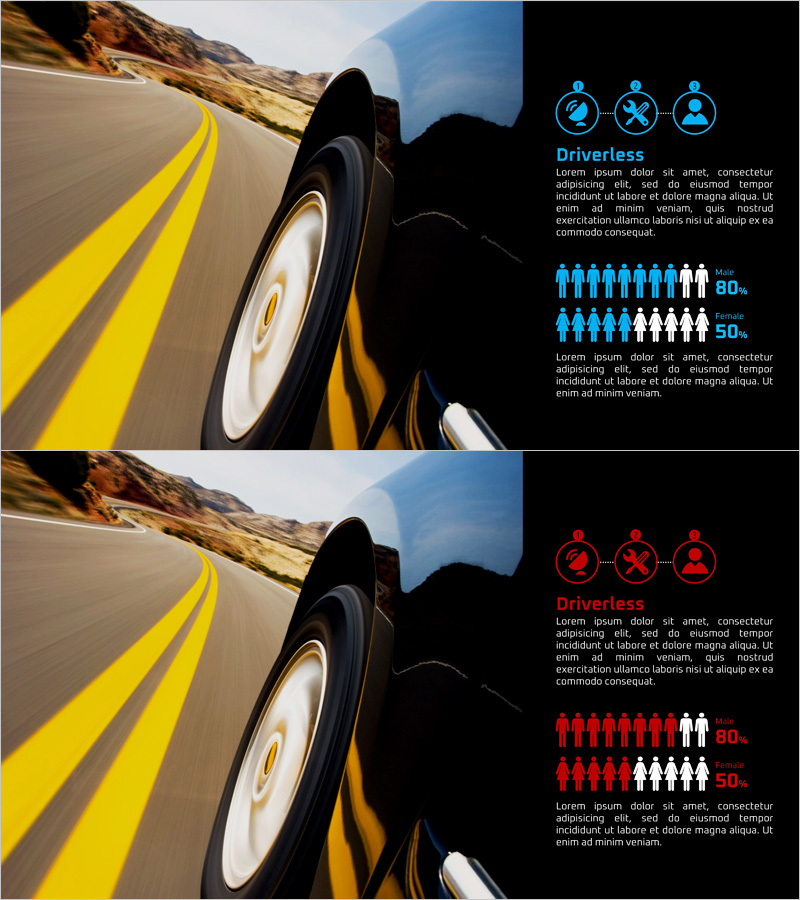
A market analysis PowerPoint slide that visualizes the gender distribution of self-driving service users at a glance. The left section uses a blue tone for male users and the right section uses a red tone for female users, with three icons (self-driving, exclusion, user) and infographic-style people charts clearly distinguishing each demographic. The top features a 'Driverless' title with descriptive text, while the bottom displays gender ratio percentages (80%, 50%, etc.) in numerical form. This structure is ready for immediate use in investor presentations, market reports, and customer analysis materials. The 2-slide set provides comparative analysis with identical layouts, available in 16:9 widescreen format and PPTX file type for editing in all PowerPoint versions.
Usage Points
-
Main Usage
This slide is used to analyze and visualize the gender distribution of self-driving service target customers through data-driven insights, supporting market opportunity identification and customer understanding. It serves as evidence-based material in investor relations presentations, business plans, and marketing strategy development phases for customer segmentation.
-
How to Use
Input male user data in the left blue section and female user data in the right red section to compare and analyze gender ratios. Modify the top icons and descriptive text to adapt the slide for analyzing gender distribution in other services or products. Adjust the number of people icons in the chart to represent accurate percentages.
-
Recommended For
Ideal for self-driving and mobility service company executives, marketing teams, market research firms, venture capital investors, consulting analysts, and new business planning teams preparing customer analysis materials. Particularly effective for presentations requiring gender-based targeting strategies.
-
Slide Structure
The 2-slide set features a consistent layout with title (Driverless) and three icons at the top, descriptive text in the upper section, a people chart showing male/female distribution in the middle, and gender ratio percentages (80%, 50%, etc.) at the bottom. The dual-tone blue and red background enables intuitive comparison of gender-based data.
Related Products
-

Analyzing Chart Results by Item – Understanding the Market and Customers
#Market and Competitor Analysis #Graph #Other
-

Table Chart on Competition and Communication - Market and Customer Analysis
#Market and Competitor Analysis #Diagram #Customer Analysis
-

Natural Environment Satisfaction Graph – Market and Customer Analysis
#Market and Competitor Analysis #Graph #Customer Analysis
-

Shopping Mall User Gender Ratio Analysis Chart
#Market and Competitor Analysis #Graph #Other
