Donut Chart Analysis and Table – Simple Data Visualization
RJ0800001_9
- Last Update 08/29/2025
- File Size 0.4MB
- # of Slides 2
- File Format PPTX
- Slide Ratio 16:9
- Color
Keywords
About the Product
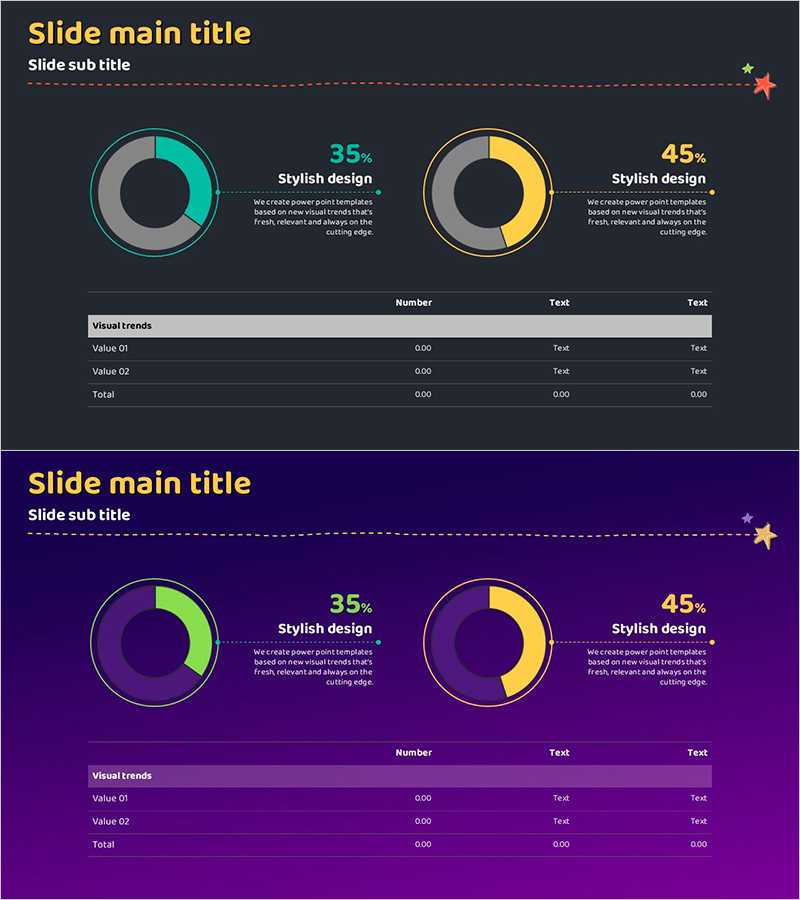
A PowerPoint slide featuring two donut charts paired with a data analysis table for comprehensive information presentation. The dark background displays turquoise and golden donut charts with percentage values and descriptive text positioned beside each chart. A table with visual trends rows and numeric input fields is included at the bottom for organizing quantitative data. This 2-slide, 16:9 ratio PPTX file is fully editable and ready for immediate use in presentations and reports.
Usage Points
-
Main Usage
Visualize quantitative data ratios using donut chart format while simultaneously organizing numerical data in table structure to clearly communicate analysis results during presentations.
-
How to Use
Replace the donut chart percentages with your actual data values and input item names and figures into the bottom table. The high-contrast dark background design ensures excellent readability in projector presentation environments.
-
Recommended For
Executive reports, business analysis presentations, marketing performance reviews, financial status updates, market research result sharing, and other data-driven decision-making materials requiring quantitative visualization.
-
Slide Structure
Slide 1: Two donut charts in turquoise and golden colors (35% and 45% indicators) with descriptive text and decorative icons on the right. Slide 2: Identical donut charts on dark purple background with analysis table below (Visual trends header row plus Value 01, Value 02, and Total rows across three columns).
Related Products
-

Arctic Business Goals Market Strategy Chart
#Market and Competitor Analysis #Financial Plans and Performance #Diagram
-

Outstanding Equipment Donut Chart – An Easy Tool for Performance Analysis
#Financial Plans and Performance #Graph #Capital Requirements
-

Patient Examination Item Table Slide – Efficient Data Management
#Financial Plans and Performance #Diagram #Capital Requirements
-

Fund Planning and Revenue Tables – Financial Performance Analysis
#Financial Plans and Performance #Diagram #Other
