Blue Gradient Horizontal Bar Chart – Market Trend Analysis
RJ0600102_27
- Last Update 08/28/2025
- File Size 0.4MB
- # of Slides 2
- File Format PPTX
- Slide Ratio 16:9
- Color
Keywords
- #Content-Based Slides
- #Design-Based Slides
- #Market and Competitor Analysis
- #Graph
- #Industry Trends
- #Horizontal Bar
- #Segmented Horizontal Bar
- #16:9
- #horizontal bar chart PowerPoint
- #market analysis slide template
- #gradient chart design
- #data comparison presentation
- #how to create bar chart in PowerPoint
About the Product
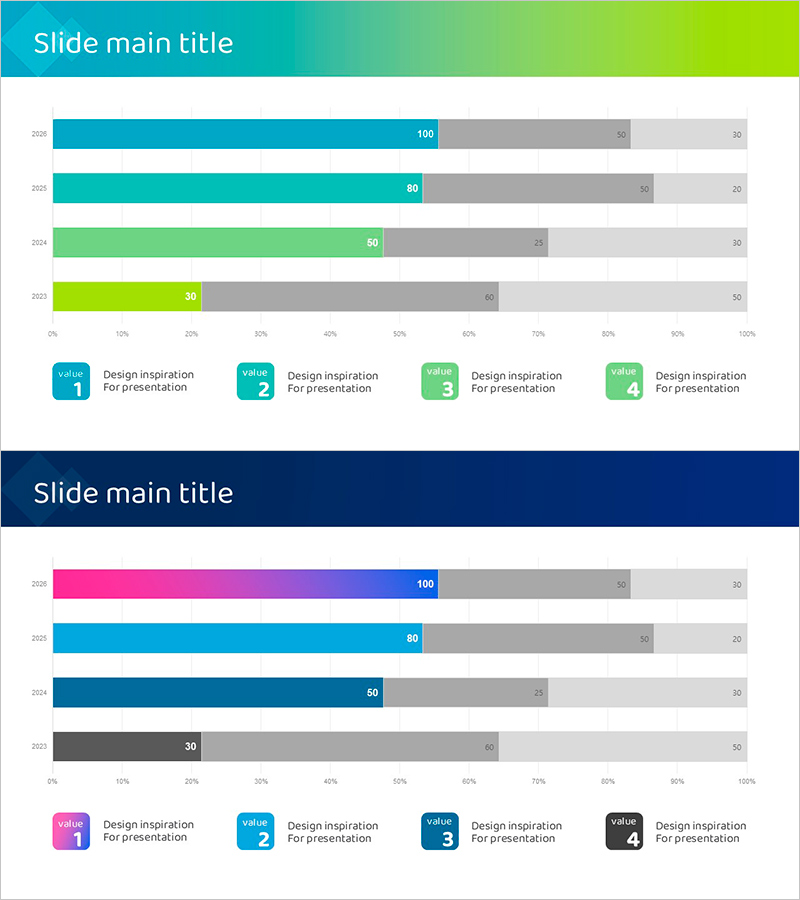
A horizontal bar chart PowerPoint slide designed for market trend and competitive analysis presentations. The gradient color scheme transitions from turquoise to lime green, visually representing the relative magnitude of data points. Each bar includes numeric labels and gray background areas for context. This 2-slide set accommodates various comparison scenarios in business reports and strategy presentations. Optimized for 16:9 widescreen format, compatible with modern projectors and digital displays.
Usage Points
-
Main Usage
Compares four data points—such as market size, sales volume, market share, or competitor metrics—using horizontal bars. The bar length immediately conveys relative magnitude, while numeric labels provide precise values for stakeholder communication.
-
How to Use
Insert into business plans, marketing strategy documents, quarterly performance reports, and market analysis sections. Ideal for executive briefings, investor presentations, and strategic planning meetings where competitive positioning and market opportunities must be clearly demonstrated. Double-click to edit values and labels instantly.
-
Recommended For
Marketing managers, strategy planners, sales directors, financial analysts, and executives presenting market conditions and competitive landscapes. Particularly suited for B2B presentations and internal meetings requiring quantitative comparisons and data-driven insights.
-
Slide Structure
2-slide set, each containing a 4-item horizontal bar chart. Features turquoise-to-lime gradient bars, gray background areas, numeric labels (100, 80, 50, 30), and four legend items (Value 1–4). Delivered in 16:9 widescreen PPTX format for seamless editing.
Related Products
-

Work and Home Life Graph – Market Trends and Design Sensibility
#Market and Competitor Analysis #Graph #Industry Trends
-

Horizontal Bar Chart for Changes in the Climbing Population – Market Trend Analysis
#Market and Competitor Analysis #Graph #Industry Trends
-

Analyzing Flower Horizontal Segmentation Charts – Understanding Market Trends
#Market and Competitor Analysis #Graph #Industry Trends
-

Bar Chart for Eco-friendly Practices Trends Visualization
#Market and Competitor Analysis #Graph #Industry Trends
