Calorie-Burning Table – Market and Customer Analysis
RJ0800024_14
- Last Update 08/06/2025
- File Size 1.1MB
- # of Slides 2
- File Format PPTX
- Slide Ratio 16:9
- Color
Keywords
- #Content-Based Slides
- #Design-Based Slides
- #Market and Competitor Analysis
- #Diagram
- #Customer Analysis
- #Market Analysis
- #Table
- #Standard Table
- #16:9
- #data comparison table PowerPoint
- #market analysis table slide
- #6-column table template
- #customer analysis data
- #comparison table PPT slide
- #business data presentation
About the Product
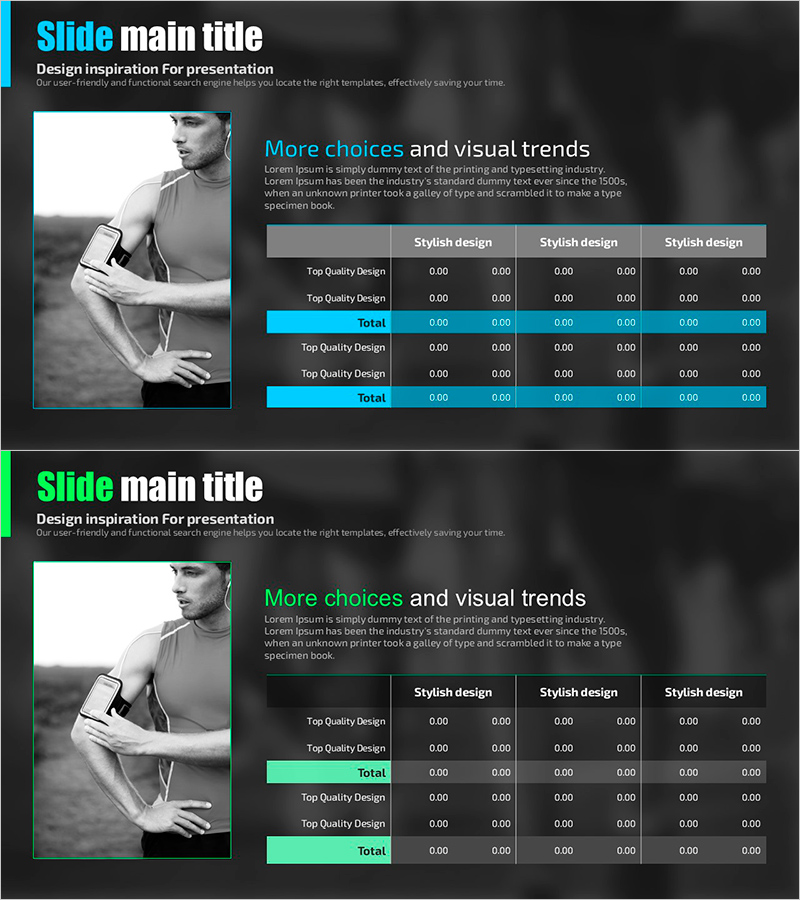
A professional data comparison table PowerPoint slide designed for market and customer analysis presentations. Features a dark background with cyan accent lines and a 6-column table structure optimized for information organization and numerical comparison. Includes 2 slides in 16:9 widescreen format, delivered as PPTX. The balanced layout combines a left-side black-and-white image with a right-side data table, making it immediately ready for business reports and presentation decks.
Usage Points
-
Main Usage
Presents quantitative information for market analysis, customer segmentation, competitor comparison, and sales data organization. The 6-column horizontal layout with multiple data rows enables clear visualization of complex comparative information and multi-dimensional datasets.
-
How to Use
Insert product photos or market images in the left image area, then populate the right table with comparison metrics, numerical values, and evaluation criteria. Use the cyan accent row to highlight key performance indicators and leverage the dark background for a professional presentation atmosphere.
-
Recommended For
Marketing managers, sales directors, executive reports, business proposals, market research presentations, and customer analysis documentation. Ideal for data-driven business presentations requiring comparative analysis and structured information display.
-
Slide Structure
2-slide set. Each slide divides into left image area (approximately 40%) and right data table (approximately 60%). Table structure: 1 header row + 4 data rows + 1 cyan accent row (total 6 rows, 6 columns). 16:9 widescreen format, PPTX file.
Related Products
-

Medical Examination Record for Customer and Market Analysis – Effective Data Visualization
#Market and Competitor Analysis #Diagram #Customer Analysis
-

Table Chart on Competition and Communication - Market and Customer Analysis
#Market and Competitor Analysis #Diagram #Customer Analysis
-

Simple PowerPoint Wide Template Evaluation Table - Easily Compare Data
#Market and Competitor Analysis #Customer Success Stories #Diagram
-

Infographic Design Wide Template Map&Table
#Market and Competitor Analysis #Financial Plans and Performance #Diagram
