Doughnut Chart for Analyzing Children's Educational Activities
RJ0500036_25
- Last Update 08/27/2025
- File Size 1MB
- # of Slides 2
- File Format PPTX
- Slide Ratio 16:9
- Color
Keywords
- #Content-Based Slides
- #Design-Based Slides
- #Market and Competitor Analysis
- #Graph
- #Competitive Advantage
- #Circles
- #Doughnut Chart
- #16:9
- #doughnut chart PowerPoint
- #donut graph slide template
- #3-segment pie chart
- #educational activity analysis PPT
- #data ratio visualization slide
- #circular graph PowerPoint template
About the Product
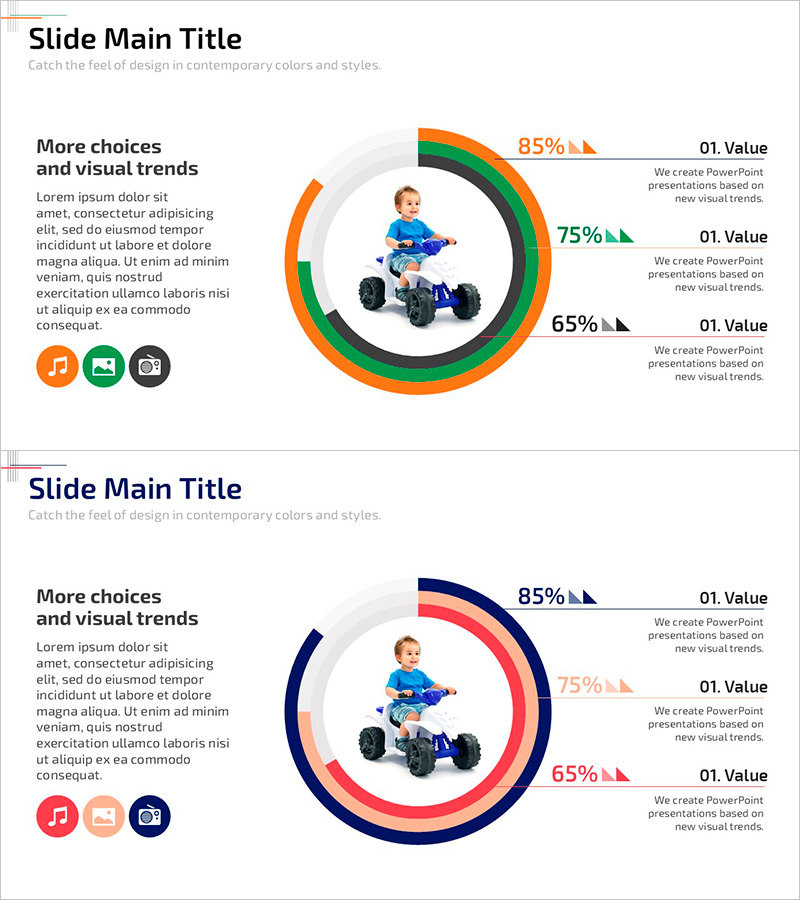
A 3-segment doughnut chart PowerPoint slide designed for analyzing children's educational activities and program outcomes. The donut graph features orange, green, and black color segments that intuitively display proportional data, with a central image area for visual impact. This 2-slide set presents different data values (85%, 75%, 65%) on each slide, making it ideal for education program evaluations, learning outcome analysis, and activity participation comparisons. The slides are fully editable in PowerPoint, allowing you to customize numerical values, colors, and text to match your presentation needs and institutional branding.
Usage Points
-
Main Usage
Visualize the compositional ratios of children's educational activities, learning outcome distributions, and program participation rates using an intuitive doughnut chart format. The central image area allows you to insert relevant photos or icons that reinforce your presentation topic and enhance visual engagement.
-
How to Use
Use this slide in end-of-semester performance presentations, parent information sessions, educational program evaluation reports, and child development analysis documents. Leverage PowerPoint's chart editing tools to modify data values and adjust colors to align with your institution's brand identity and presentation theme.
-
Recommended For
Kindergarten and elementary school teachers, education department officials, child psychology specialists, education consultants, and parent communication coordinators presenting learning outcomes, activity participation rates, and developmental domain distributions.
-
Slide Structure
2-slide set featuring doughnut charts with 3 data segments (displaying 85%, 75%, and 65% values respectively). Each slide includes a central image placeholder, right-aligned legend, and descriptive text areas. Formatted in 16:9 widescreen ratio for optimal display on modern presentation systems.
Related Products
-

Earth Analysis Donut Circle Graph – Enhancing Market Competitiveness
#Market and Competitor Analysis #Graph #Competitor Analysis
-

Watercolor Customer Analysis Donut Chart – Visualizing Market Share
#Market and Competitor Analysis #Graph #Market Share
-

Visualization of War Equipment Penetration Rate – Market Share Analysis
#Market and Competitor Analysis #Graph #Market Share
-

Competitive Advantage Donut Pie Chart (3 colors) – Frontline of Market Analysis
#Market and Competitor Analysis #Graph #Competitor Analysis
