Green Red Business Table – Market Analysis Slide
RJ0500024_11
- Last Update 08/27/2025
- File Size 1.8MB
- # of Slides 2
- File Format PPTX
- Slide Ratio 16:9
- Color
Keywords
About the Product
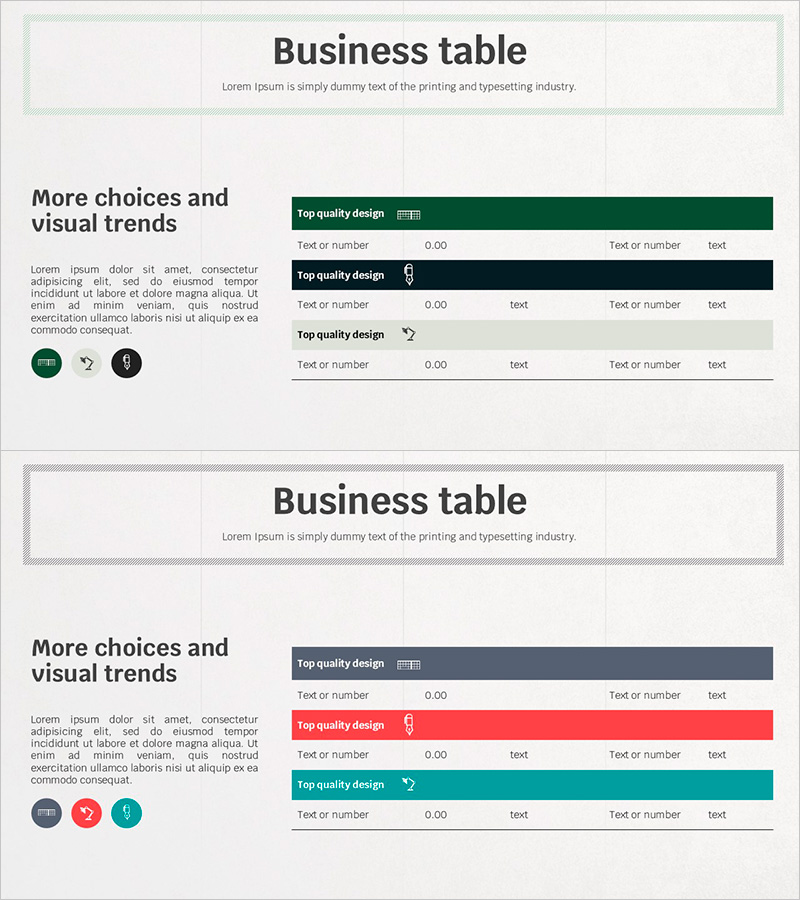
A 3-row data table PowerPoint slide optimized for market analysis and competitive comparison. Features green and red header rows to highlight key items, with editable text, number, and label fields in each row. Delivered as 2 slides in 16:9 widescreen format, ready for immediate use in business presentations, reports, and proposals. The color-coded structure clearly conveys information hierarchy and enables quick data visualization for stakeholder communication.
Usage Points
-
Main Usage
Presents quantitative information—market analysis, competitor comparison, product feature comparison, financial data—in clear tabular format. Color-coded header rows visually distinguish importance and category hierarchy for executive-level communication.
-
How to Use
Enter text, numbers, and labels into each cell. Green and red header rows indicate category or priority level; lower rows contain comparison items. Colors and fonts are fully customizable to match your brand or presentation theme.
-
Recommended For
Executives, marketing teams, strategy teams, and sales professionals presenting market insights, competitive analysis, product comparisons, and performance metrics. Ideal for business plans, investor pitch decks, proposals, and quarterly business reviews.
-
Slide Structure
2-slide deck with 3-row × 4-column data table structure on each slide. First row features green or red header highlighting. Text and number input areas are clearly defined. Optimized for 16:9 widescreen display and professional business environments.
Related Products
-

Observation Status Analysis Graph – Market and Competitor Analysis
#Market and Competitor Analysis #Diagram #Graph
-

Blackboard and Comparison Table Chart – Optimized for Market and Competitor Analysis
#Market and Competitor Analysis #Diagram #Competitor Analysis
-

Shareholder Status Detailed Analysis Pie Chart & Table – Impactful Data Visualization
#Company Introduction #Market and Competitor Analysis #Diagram
-

Performance Analysis Pie Chart – Market Share Visualization
#Market and Competitor Analysis #Diagram #Graph
