Blue Red Table – Data Slide for Market Analysis
RJ0400033_13
- Last Update 08/27/2025
- File Size 2.9MB
- # of Slides 2
- File Format PPTX
- Slide Ratio 16:9
- Color
Keywords
About the Product
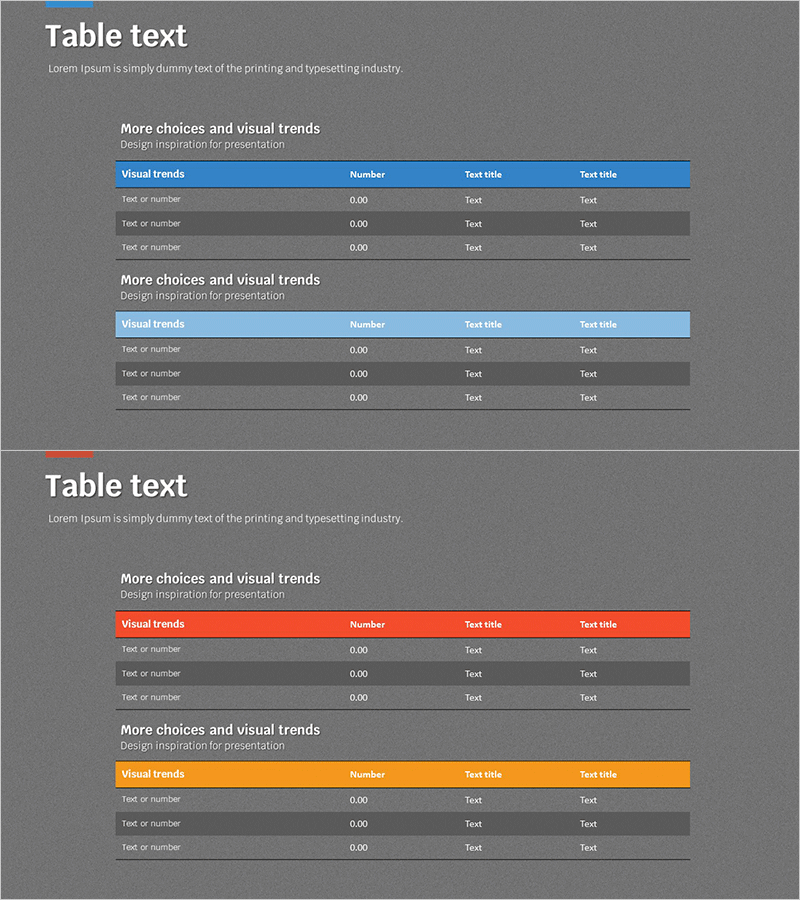
A professional data comparison slide set optimized for market analysis and statistical presentations. Features two color variations with blue and red headers, each providing three rows of editable data entry fields. Fully customizable in PowerPoint with a clean grid structure that accommodates numbers, text, and percentage information. Ideal for competitive analysis, performance metrics, market statistics, and quarterly business reviews in corporate presentations.
Usage Points
-
Main Usage
Transforms quantitative data into structured tabular format for enhanced audience comprehension. Organizing numbers, percentages, and text in a matrix layout enables intuitive comparative analysis. Effectively communicates multi-item comparisons such as market size, sales volume, and customer satisfaction metrics.
-
How to Use
Input data directly into slide cells and add or remove rows as needed. Use the blue header version for trust-building and positive performance presentations, and the red header for emphasis and alert-focused reports. Customize font styles and cell background colors to highlight key data points.
-
Recommended For
Recommended for finance, marketing, and sales professionals preparing quarterly and annual performance reports. Enhances data credibility in executive briefings, investor presentations, and client proposals. Suitable for academic presentations, research findings, and industry analysis reports.
-
Slide Structure
Two-slide set: Slide 1 features blue header with 4-column table and 3 data rows; Slide 2 mirrors the structure with red header. Each cell supports text and numeric input with header row emphasized through color background. 16:9 widescreen format ensures compatibility with modern projectors and displays.
Related Products
-

Target Market Analysis Table
#Company Introduction #Market and Competitor Analysis #Diagram
-

Blackboard and Comparison Table Chart – Optimized for Market and Competitor Analysis
#Market and Competitor Analysis #Diagram #Competitor Analysis
-

Shareholder Status Detailed Analysis Pie Chart & Table – Impactful Data Visualization
#Company Introduction #Market and Competitor Analysis #Diagram
-

Market Analysis Report Visualized with Pie Chart
#Market and Competitor Analysis #Diagram #Graph
