Calendar and Table Charts - Visualizing Business Strategy
RJ0300028_33
- Last Update 08/27/2025
- File Size 2.1MB
- # of Slides 2
- File Format PPTX
- Slide Ratio 16:9
- Color
Keywords
- #Content-Based Slides
- #Design-Based Slides
- #Business Strategy
- #Operational Plan
- #Diagram
- #Implementation Framework
- #Project Implementation Schedule
- #Table
- #16:9
- #calendar table PowerPoint slide
- #timeline arrow presentation design
- #project schedule slide
- #business timeline table PPT
- #how to visualize project schedule in PowerPoint
About the Product
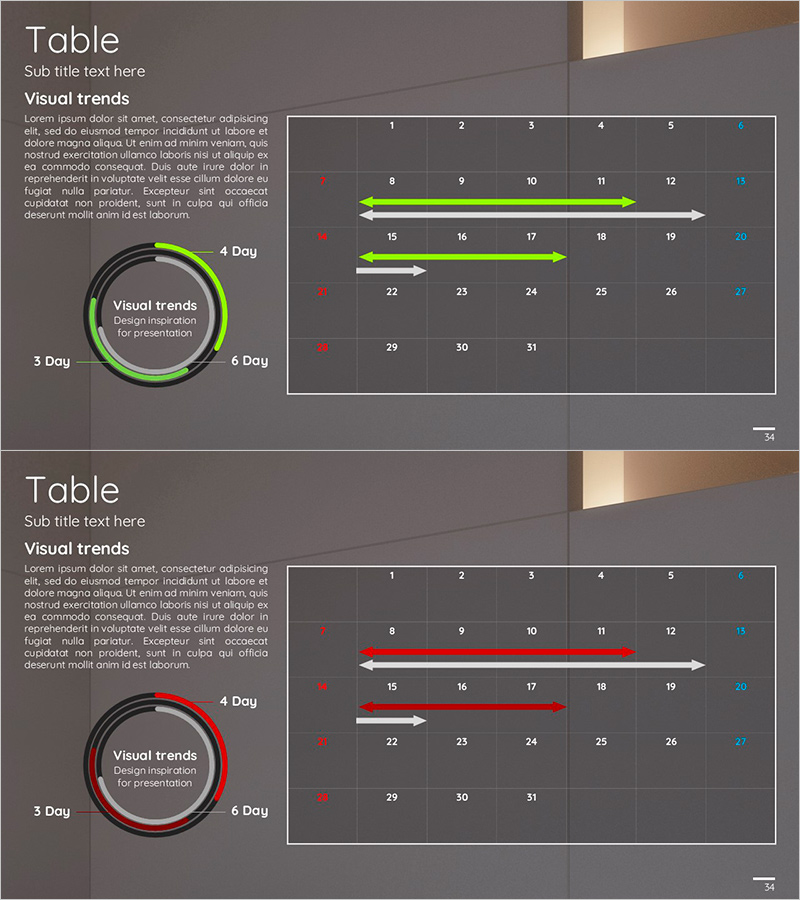
A calendar and table PowerPoint slide designed to visualize business strategy and project timelines. The slide features a dark gray background with a white grid table and fluorescent green or red arrow overlays to clearly communicate project schedules and progress status. The 2-slide set includes a circular progress diagram (3-6 day cycles) paired with a calendar table on the first slide, and a color-variant version on the second slide for flexible presentation scenarios. With separate text description areas and data input spaces, this PPT slide is ready to use in company presentations, business plans, and operational planning decks.
Usage Points
-
Main Usage
Communicate project timelines, business execution plans, and operational schedules using both table format and timeline arrows to stakeholders and team members. Optimized for business introduction decks (execution roadmap section), business plans (implementation timeline), and operational planning presentations (phase-by-phase schedule).
-
How to Use
Enter dates, weeks, or months in the table cells and adjust arrow length and position to indicate each phase duration. Modify the circular progress diagram text to highlight key milestones. Use the color-variant slide to compare multiple projects or scenarios side by side.
-
Recommended For
Executives, project managers, business development teams, and marketing planners presenting strategy and operational plans. Recommended for business plans, operational planning documents, strategy presentations, investor briefings, and internal progress reports where schedule management and progress tracking are essential.
-
Slide Structure
2-slide set. Each slide features a left section with title, subtitle, and descriptive text area (approximately 200 characters), upper right with a circular progress diagram (4 segments for 3-6 day cycles), and lower right with a 5-column × 5-row table (25 cells) and 3 timeline arrows. Color variants switch accent elements from green to red for visual flexibility.
Related Products
-

Performance Schedule Slide – Business Management and Operational Planning
#Business Management #Operational Plan #Diagram
-

Rocket Launch Schedule Plan – Efficiency in Project Management
#Business Management #Operational Plan #Diagram
-

Brand Marketing Execution Plan PowerPoint Template – Business Strategy
#Business Strategy #Operational Plan #Diagram
-

Yearly Progress Schedule Plan Visualized for Project Management
#Business Management #Operational Plan #Diagram
