SWOT Overlay Analysis Table – Effective Market Analysis Tool
RM0100002_23
- Last Update 01/24/2025
- File Size 0.4MB
- # of Slides 4
- File Format PPTX
- Slide Ratio 16:9
- Color
Keywords
About the Product
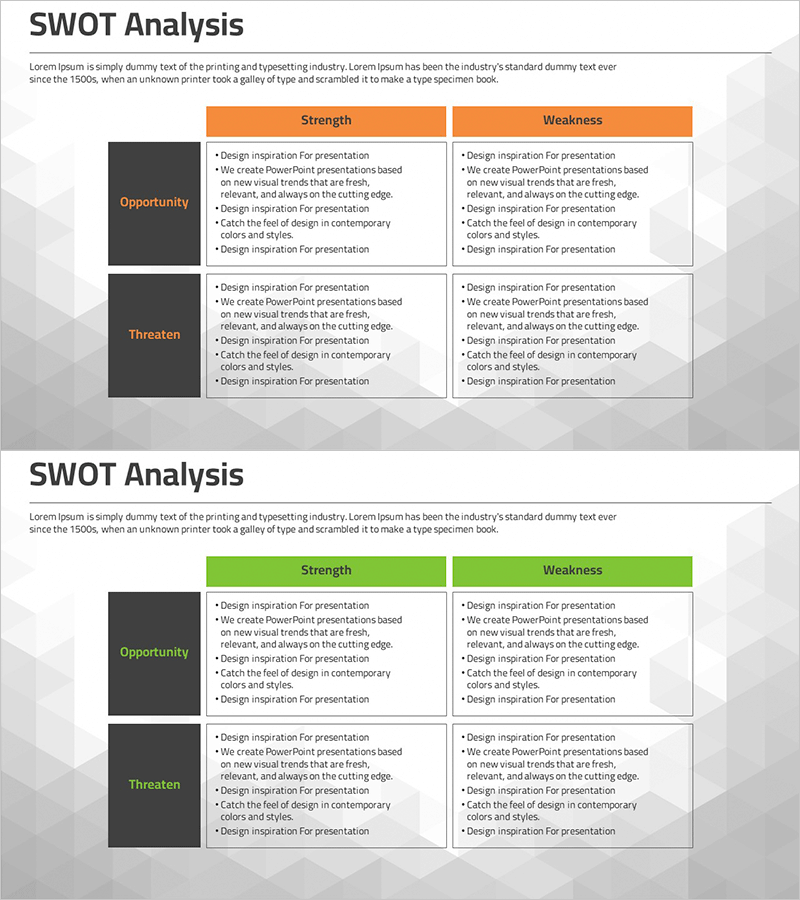
A comprehensive SWOT analysis table PowerPoint slide set featuring 4 slides designed for strategic planning and competitive analysis. The 2×2 matrix structure clearly separates Strength, Weakness, Opportunity, and Threat quadrants, enabling systematic organization of strategic information. Each slide uses distinct color combinations with orange, green, and gray headers paired with white input areas, providing visual variety for presentations. Formatted in 16:9 widescreen PPTX for modern presentation environments, with fully editable text fields for immediate customization and deployment in business strategy meetings, market analysis reports, and competitive positioning presentations.
Usage Points
-
Main Usage
A strategic analysis tool for corporate planning, market assessment, and competitive positioning. The 2×2 matrix structure clearly delineates four analysis quadrants, enabling data-driven decision-making and strategic recommendation development for executive presentations.
-
How to Use
Input relevant content into each of the four quadrants (Strength, Weakness, Opportunity, Threat) on each slide. Select color variants matching your presentation theme or corporate branding. Fully editable text allows easy modification of bullet points, fonts, and formatting to suit specific analysis requirements.
-
Recommended For
Ideal for executives, strategy managers, marketing planners, and business development teams presenting at board meetings, strategic planning sessions, and business case reviews. Essential for new market entry analysis, product launch strategy, and competitive positioning assessments.
-
Slide Structure
4-slide set with consistent 2×2 matrix layout. Each slide features top-left Strength (orange header), top-right Weakness (orange header), bottom-left Opportunity (gray/green header), and bottom-right Threat (gray/green header) quadrants. Four color variants provided with ample white space in each quadrant for content input.
Related Products
-

Market Analysis Donut Chart & Table Slide
#Market and Competitor Analysis #Diagram #Graph
-

Game Data Analysis Table – Market Analysis and Trends
#Product/Service Introduction #Market and Competitor Analysis #Diagram
-

Detailed Analysis of Shareholder Status Donut Chart
#Company Introduction #Market and Competitor Analysis #Diagram
-

Shareholder Status Detailed Analysis Pie Chart & Table – Impactful Data Visualization
#Company Introduction #Market and Competitor Analysis #Diagram
