Building Market Vertical Accumulation Chart
RJ0900031_6
- Last Update 08/25/2025
- File Size 8.6MB
- # of Slides 2
- File Format PPTX
- Slide Ratio 16:9
- Color
Keywords
- #Content-Based Slides
- #Design-Based Slides
- #Market and Competitor Analysis
- #Graph
- #Industry Trends
- #Column
- #Segmented Column
- #16:9
- #vertical stacked bar chart PowerPoint
- #building market analysis presentation
- #stacked chart slide
- #market trend graph
- #construction market data visualization
- #how to create stacked bar chart in PowerPoint
About the Product
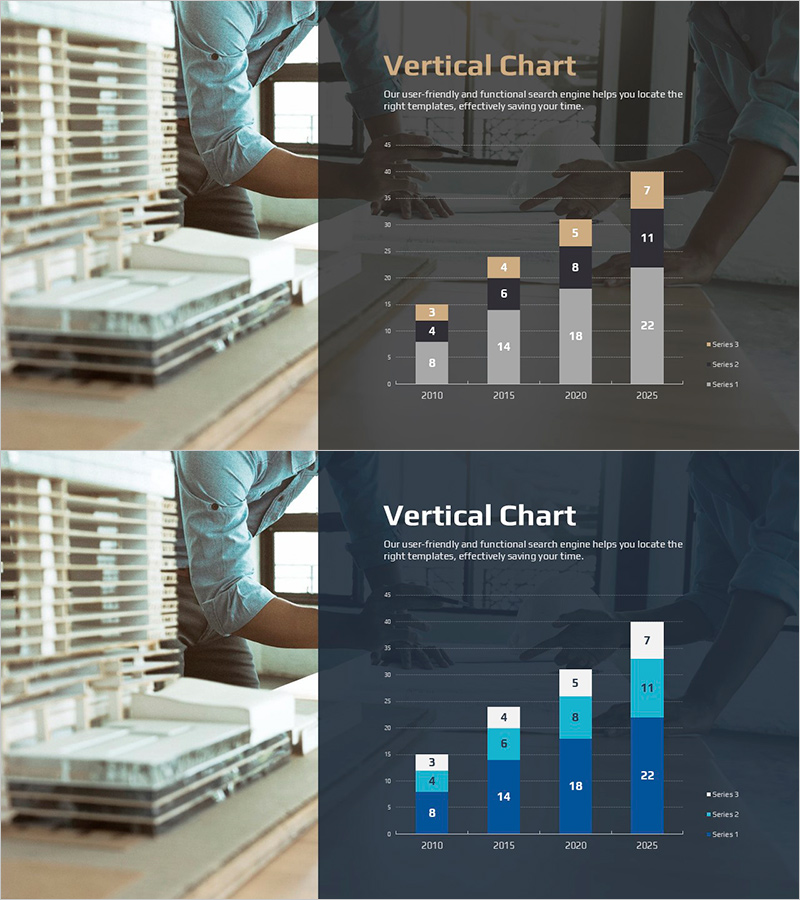
A vertical stacked bar chart PowerPoint slide designed to visualize building market data across multiple years. This presentation template displays market trends from 2010 to 2025 in 5-year intervals, segmented into 3 data series to show both cumulative totals and individual component values simultaneously. Each bar includes clear numerical labels for precise data communication during presentations. The design features a dark background with beige, light gray, and white bar colors, presented across 2 slides with different color variations of the same data structure. Available in 16:9 widescreen PPTX format, fully editable and ready for immediate use in construction, real estate, and market analysis presentations.
Usage Points
-
Main Usage
This chart is optimized for displaying year-over-year growth trends and component composition ratios in the construction and real estate markets simultaneously. The stacked bar format enables viewers to compare total market size and individual segment changes at a glance, making it ideal for market analysis reports, competitive analysis, and business plan presentations requiring credible data visualization.
-
How to Use
Open the slide and double-click the chart area to access the data table. Enter years, series names, and numerical values to automatically update the graph. To modify colors, select individual bars and adjust the fill options. Choose your preferred color combination from the 2 available slides and insert into your presentation deck.
-
Recommended For
Ideal for construction, real estate, and building industry executives, marketing teams, and sales professionals presenting market analysis. Suitable for investment pitch decks, business plan market overview sections, management reports comparing year-over-year performance, and any presentation requiring quantitative data-driven credibility and professional visualization.
-
Slide Structure
2-slide template. Each slide contains a title area (Vertical Chart), descriptive text, and a vertical stacked bar chart. The chart displays years on the X-axis (2010, 2015, 2020, 2025) and values on the Y-axis (0-45), with 3 data series stacked to show cumulative totals. Numerical labels appear above each bar segment, displaying both cumulative values and individual series values for precise data interpretation.
Related Products
-

Structure Presentation Template Segmented Vertical Bar Graph – Market Trends and Performance Analysis
#Market and Competitor Analysis #Financial Plans and Performance #Diagram
-

Analyzing Future Prospect Graphs
#Market and Competitor Analysis #Diagram #Graph
-

Four-Year Industrial Market Trends – Market Analysis and Decisions
#Market and Competitor Analysis #Financial Plans and Performance #Graph
-

Graph of Changes After a Healthy Diet – Data Visualization Template
#Market and Competitor Analysis #Graph #Market Analysis
