Sleek Diagram Slide for Target Area Analysis
RJ0900028_38
- Last Update 08/24/2025
- File Size 0.9MB
- # of Slides 2
- File Format PPTX
- Slide Ratio 16:9
- Color
Keywords
- #Content-Based Slides
- #Design-Based Slides
- #Company Introduction
- #Market and Competitor Analysis
- #Diagram
- #Other
- #Global Network
- #Market Analysis
- #Cluster
- #Chain Diagram
- #16:9
- #world map diagram PowerPoint
- #regional analysis slide template
- #target market connection diagram
- #global network PPT
- #map-based presentation slide
About the Product
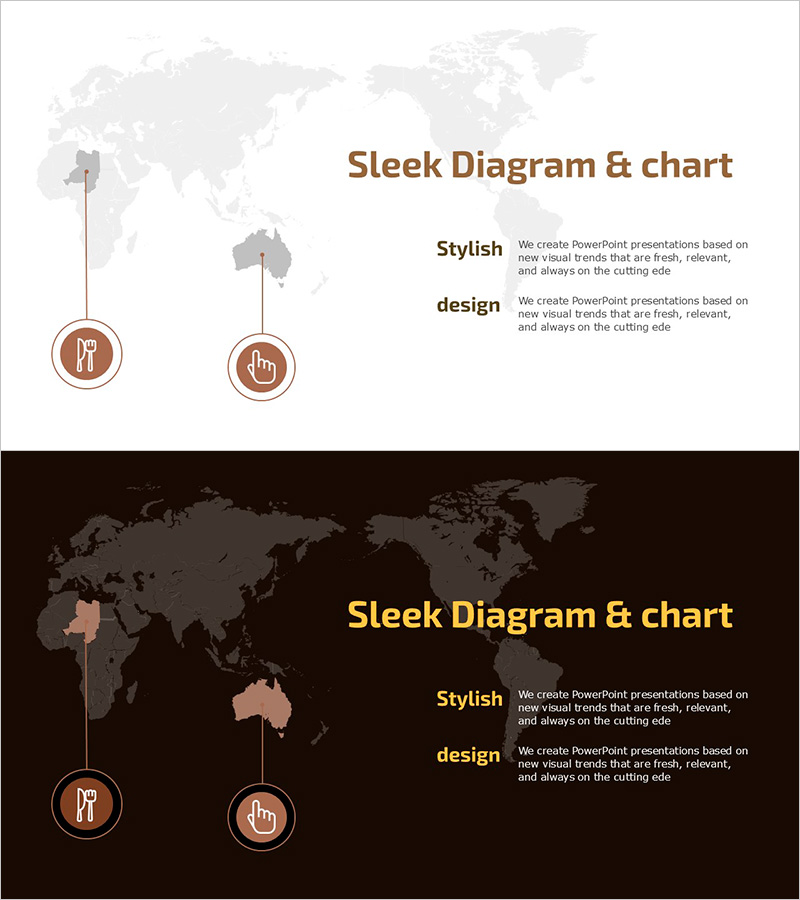
A PowerPoint diagram slide featuring a world map with two selected regions connected by vertical lines and circular icons. This slide template is designed for target market analysis, regional comparison, and global network strategy presentations. Each region displays an icon and text area for customization, with information hierarchy clearly defined through brown-toned icons and text on a light background. A dark background version is also included for flexible presentation styling. The 2-slide set is ready for immediate editing and use.
Usage Points
-
Main Usage
This diagram visualizes relationships, comparisons, and connections between specific regions on a world map. It effectively communicates target market analysis, regional business expansion, global partnerships, and international collaboration structures to enhance audience comprehension.
-
How to Use
Click the circular icons and text areas above the two regions to enter region names, figures, and descriptions. Adjust the connection line color and thickness, or insert additional text boxes to emphasize relationship strength or direction. Choose between the light or dark background version based on your presentation theme.
-
Recommended For
Marketing, sales, and strategy professionals presenting market entry plans, regional revenue comparisons, and global expansion strategies. Also effective for executive reports, investment pitch decks, and international business proposals where regional relationships need clear visualization.
-
Slide Structure
2-slide set. Each slide features a world map background highlighting two regions connected by vertical lines. Circular icons (brown tone) are positioned above each region, with a text area on the right for 'Stylish design' content. The first slide has a light background; the second features a dark background for design flexibility.
Related Products
-

Global Market Snapshot – Market Analysis and Outlook
#Company Introduction #Market and Competitor Analysis #Diagram
-

Worldwide Organic Food Production Map – Global Market Analysis
#Company Introduction #Market and Competitor Analysis #Diagram
-

Global Market Entry Plan – Continuous Growth Strategy
#Company Introduction #Marketing Plan and Strategy #Diagram
-

Target Market Analysis Table
#Company Introduction #Market and Competitor Analysis #Diagram
