Blue Green Map Data Analysis – Visualization of Global Network
RJ0800024_15
- Last Update 08/06/2025
- File Size 1MB
- # of Slides 2
- File Format PPTX
- Slide Ratio 16:9
- Color
Keywords
About the Product
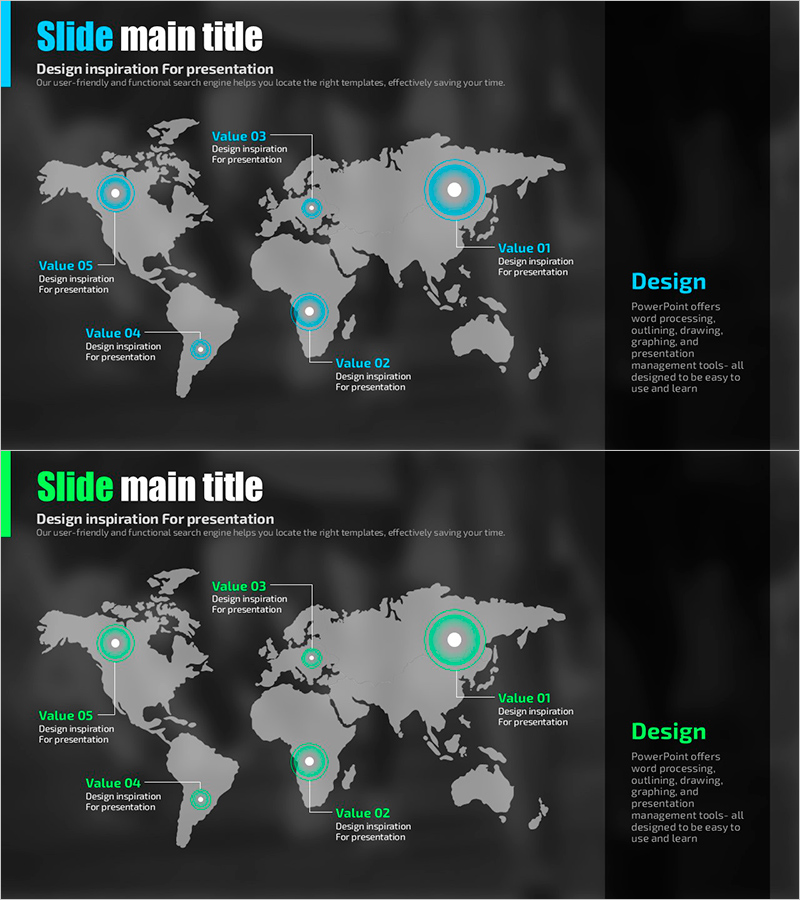
A world map-based data analysis PowerPoint slide that visualizes global business distribution at a glance. The design features a dark gray background with a light gray world map positioned centrally, and five circular point markers placed at key regions to represent global network distribution. Each marker is connected to a label and descriptive text box for clear regional data representation. The 2-slide set offers multiple color combinations (blue, green, light blue) for immediate use in presentations, company profiles, and international business reports. All elements are fully editable, allowing you to easily customize region names and data points to match your specific needs.
Usage Points
-
Main Usage
Visualize global business status, international branch distribution, overseas market expansion, and multinational network structures using map-based design. Display regional data points clearly to communicate international business strategy and support reporting materials for executive presentations.
-
How to Use
Insert into the global network section of company profiles, regional status pages in international business reports, or global expansion strategy slides in investor pitch decks. Customize each point marker label and descriptive text with actual region names and corresponding data values.
-
Recommended For
International business managers, global marketing teams, overseas business development departments, multinational company executives preparing reports, international conference presenters, and sales managers responsible for presenting regional sales performance and market distribution.
-
Slide Structure
2-slide set. Each slide features a dark gray background with a light gray world map centered on the canvas. Five circular point markers (approximately 40px diameter) are positioned at key regions (North America, Europe, Asia, South America, Africa). Each marker connects to a label (Value 01–05) and descriptive text box. Color combinations vary by slide, utilizing blue, green, and light blue palettes.
Related Products
-

Global Partnership Mediated by Nature – Eco-Friendly Design
#Company Introduction #Business Introduction #Diagram
-

Orange Yellow Map Location Indicator – Global Network Indicator
#Company Introduction #Diagram #Other
-

Global Infrastructure Slide – Visualizing Global Networks
#Company Introduction #Business Introduction #Diagram
-

Global Market Entry Plan – Continuous Growth Strategy
#Company Introduction #Marketing Plan and Strategy #Diagram
