ESG Cost Saving Analysis Slide – Sustainability and Growth
RM0700013_14
- Last Update 10/15/2025
- File Size 0.3MB
- # of Slides 2
- File Format PPTX
- Slide Ratio 16:9
- Color
Keywords
- #Content-Based Slides
- #Design-Based Slides
- #Business Vision and Strategy
- #Corporate Social Responsibility
- #Diagram
- #Graph
- #Text Box
- #Business Goals
- #Environmental Protection Efforts
- #ESG
- #Column
- #Column Chart
- #Arrow
- #Rounded Rectangle Text Box
- #16:9
- #rounded rectangle text box PowerPoint slide
- #ESG cost reduction presentation
- #sustainability slide template
- #6-item comparison slide
- #ESG analysis PowerPoint download
- #text box slide design
About the Product
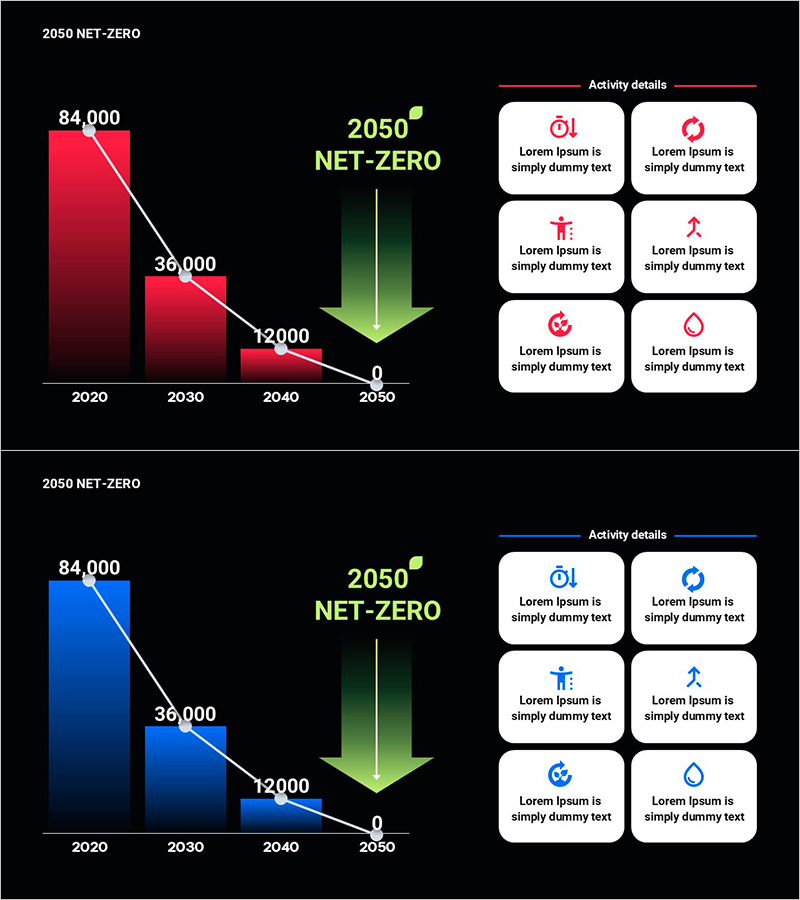
A 2-slide PowerPoint presentation designed to visualize ESG cost reduction impact and sustainability goals. Six rounded rectangle text boxes are arranged in a 2×3 grid layout, each highlighting a specific ESG activity area with corresponding icons. The first slide displays a declining trend line from 84,000 to 0 across 2020–2050, demonstrating cumulative savings. The second slide presents six sustainability dimensions (energy, circular economy, workforce, growth, environment, water) with visual icons and editable text fields. Available in red and blue color variants to match corporate branding. Delivered in 16:9 widescreen PPTX format for immediate editing and presentation use.
Usage Points
-
Main Usage
Communicate corporate ESG strategy execution, cost savings, and sustainability performance to stakeholders through data-driven visuals. The declining trend line demonstrates quantifiable progress toward 2050 net-zero targets, while the six text boxes break down specific impact areas, enabling clear messaging for investor relations, sustainability reports, and executive briefings.
-
How to Use
Begin with the first slide to establish the overall cost reduction trajectory and net-zero commitment. Transition to the second slide to detail each of the six ESG activity areas using the rounded text boxes. Click each box to edit labels, descriptions, and numerical values. Select between red or blue color schemes to align with your corporate identity. Suitable for investor presentations, annual sustainability reports, board meetings, and employee engagement sessions.
-
Recommended For
ESG officers, sustainability strategists, financial analysts, investor relations teams, and corporate communications professionals. Ideal for organizations disclosing ESG performance to stakeholders, preparing integrated reports, conducting investor briefings, or communicating net-zero commitments. Best suited for mid-to-large enterprises demonstrating measurable progress on environmental and social goals.
-
Slide Structure
Slide 1: Declining trend line chart showing 84,000 → 36,000 → 12,000 → 0 across years 2020, 2030, 2040, 2050 (red or blue gradient). Slide 2: 2×3 grid of six rounded rectangle text boxes, each containing an icon, label, and editable description area, with 'Activity details' header. Both slides feature black background with white typography and rounded box borders for visual consistency.
Related Products
-

Target Profit Calculation Table – Strategy for Business Success
#Business Vision and Strategy #Financial Plans and Performance #Diagram
-

Carbon Neutral Service Business Goal Slide – Social Responsibility and Environmental Protection
#Corporate Social Responsibility #Diagram #Environmental Protection Efforts
-

3-Step Coffee Sales Plan
#Business Vision and Strategy #Business Management #Diagram
-

Social Responsibility Diffusion Diagram – A New Vision for Environmental Protection
#Corporate Social Responsibility #Diagram #Environmental Protection Efforts
