Market Share Analysis with Blue Purple Donut Graph
RJ0900024_5
- Last Update 08/23/2025
- File Size 0.5MB
- # of Slides 2
- File Format PPTX
- Slide Ratio 16:9
- Color
Keywords
About the Product
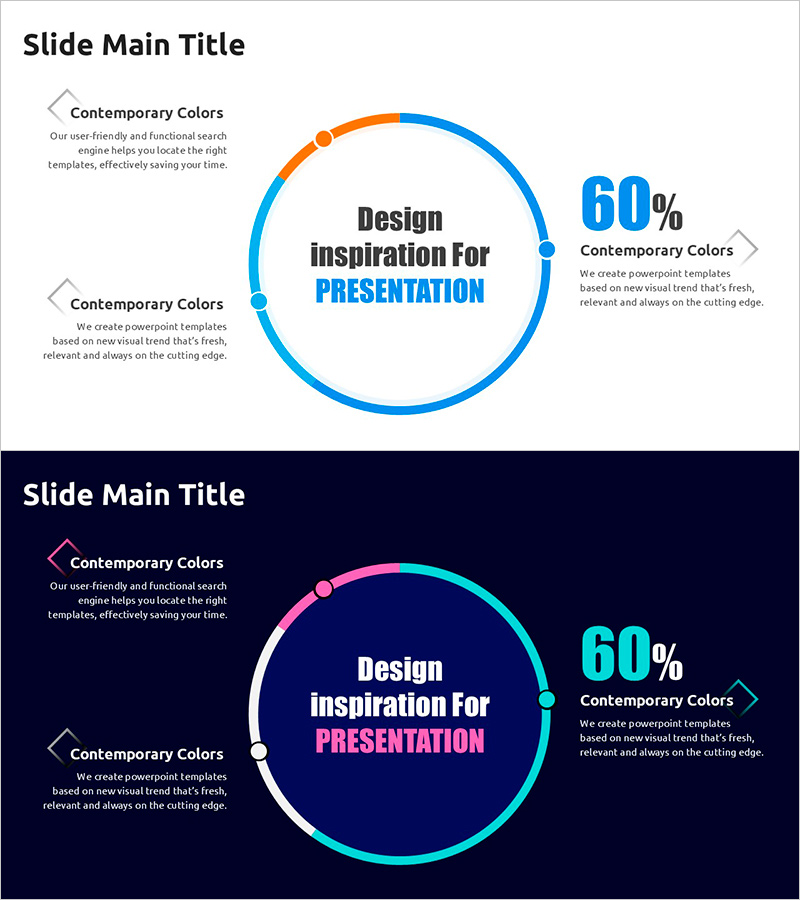
A donut chart PowerPoint slide designed for market share analysis and competitive comparison. The circular graph features a blue-to-orange gradient that intuitively represents data proportions, with a central space for key messages. Two diamond-shaped text boxes on the left and percentage indicators on the right effectively communicate additional information. This slide deck is ideal for business reports, marketing presentations, and competitive analysis in sales pitches. Two slide layouts are included—one with a light background and one with a dark navy background—allowing you to match your presentation environment. The PPTX format enables quick editing of chart values and text fields.
Usage Points
-
Main Usage
Visualizes part-to-whole relationships such as market share, competitor comparison, and customer composition ratios. The donut chart's central space allows you to emphasize key metrics or messages, while the left text boxes provide space for item descriptions and explanations.
-
How to Use
Open the slide and double-click the donut chart to edit data values—proportions update automatically. Fill in the left diamond text boxes with item names and descriptions, then update the percentage figures on the right. Choose between the light or dark background version based on your presentation setting.
-
Recommended For
Marketing managers, business strategists, financial analysts, and sales executives presenting market updates, competitive analysis, and customer segmentation. Effective for quarterly business reviews, new venture proposals, and investor pitch decks where data-driven visuals support decision-making.
-
Slide Structure
Two-slide layout with each slide featuring a central donut chart (two-color gradient), two diamond-shaped text boxes on the left (for item descriptions), and percentage indicators on the right (60% example). Slide 1 has a light background; Slide 2 features a dark navy background for flexible presentation options.
Related Products
-

Donut Chart for Components and Market Share Visualization – Market Analysis
#Market and Competitor Analysis #Graph #Market Status
-

Market Share Analysis Graph by Technology – Competition and Collaboration
#Market and Competitor Analysis #Diagram #Graph
-

Pie Chart for Decimal Ratio Analysis – Market Share Status
#Market and Competitor Analysis #Graph #Market Status
-

Visualizing Fish Market Share with Doughnut Chart – Vitality of the Ocean
#Market and Competitor Analysis #Graph #Market Status
