Future Outlook and Expected Effects Graph – Vision and Growth
RJ0900024_15
- Last Update 08/23/2025
- File Size 6.5MB
- # of Slides 2
- File Format PPTX
- Slide Ratio 16:9
- Color
Keywords
About the Product
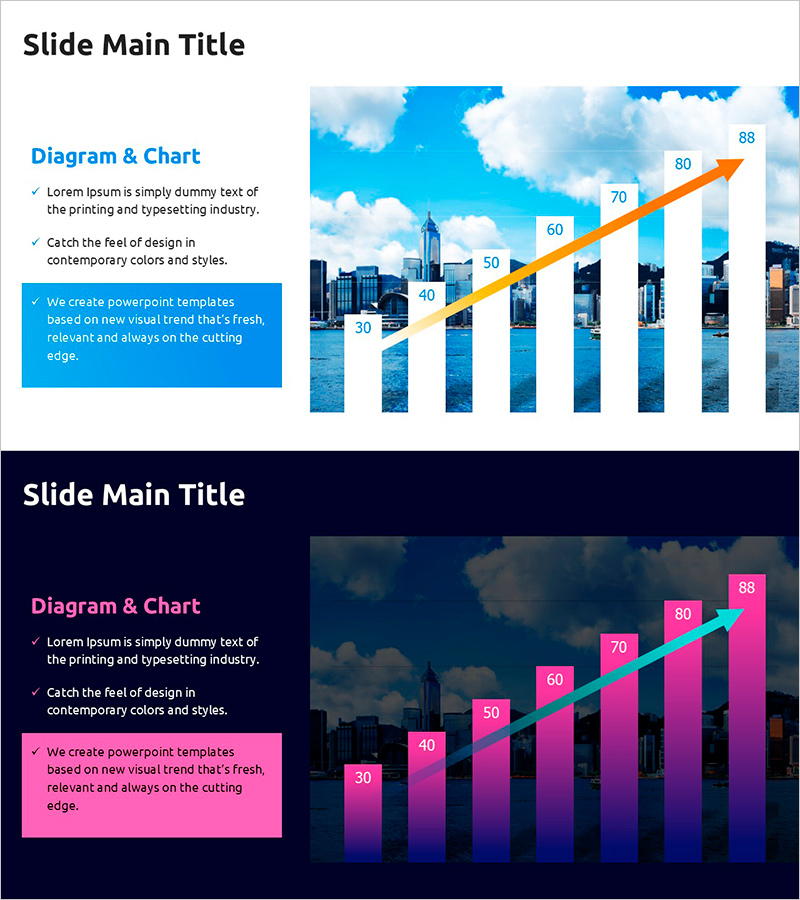
A 2-slide PowerPoint presentation that clearly communicates future outlook and expected effects through data visualization. The first slide features a bright sky background with a cityscape, an orange upward arrow, and a 6-stage bar chart emphasizing growth trends. The second slide uses a dark background with pink and green gradient bars to represent the same data in a different tone, providing presentation versatility. Both slides are divided into a left text area and right chart area for immediate use in business presentations. This PPT template is optimized for business analysis, performance reporting, and future planning presentations.
Usage Points
-
Main Usage
The core objective is to visually emphasize numerical data when reporting business performance, presenting future outlook, and explaining expected effects. This slide simultaneously expresses a 6-stage upward trend through bar charts and arrows, intuitively conveying growth direction. It is used in investor pitches, executive reports, and strategic planning presentations.
-
How to Use
Enter key messages (vision, goals, expected effects) in the left text area and replace the right chart numbers with actual data. The bright background slide suits daytime presentations or well-lit conference rooms, while the dark background slide works better in low-light environments or evening presentations. Select the appropriate version based on your presentation context.
-
Recommended For
Recommended for executives, business development teams, marketing teams, finance teams, consultants, and startup founders who need to convey growth data and future plans persuasively. Ideal for quarterly performance reports, annual business plan presentations, investment pitches, and new business proposals.
-
Slide Structure
Slide 1: Bright sky background + cityscape image + left blue text box (3 lines) + right 6-stage bar chart (values 30–88) + orange upward arrow. Slide 2: Dark background + cityscape image + left pink text box (3 lines) + right 6-stage bar chart (pink and green gradient) + green upward arrow. 16:9 aspect ratio, PPTX format.
Related Products
-

Subdivision Graph for Market Analysis – Competitor Insights
#Market and Competitor Analysis #Graph #Competitor Analysis
-

Key Personnel Ability Analysis Graph – Highlighting Company Core Strengths
#Company Introduction #Market and Competitor Analysis #Graph
-

Business Analysis Bilinear Bar Graph
#Market and Competitor Analysis #Graph #Competitor Analysis
-

Market Analysis Bundle Vertical Bar Graph – Effective Data Visualization
#Market and Competitor Analysis #Graph #Competitor Analysis
