500% Goal Achieved Graph – Challenge and Achievement
RJ0900024_10
- Last Update 08/23/2025
- File Size 0.5MB
- # of Slides 2
- File Format PPTX
- Slide Ratio 16:9
- Color
Keywords
- #Content-Based Slides
- #Design-Based Slides
- #Business Strategy
- #Financial Plans and Performance
- #Graph
- #Achievements
- #Sales and Revenue
- #Column
- #Segmented Column
- #16:9
- #stacked bar chart PowerPoint
- #cumulative bar graph slide
- #monthly goal achievement PowerPoint
- #data visualization slide
- #business performance chart template
About the Product
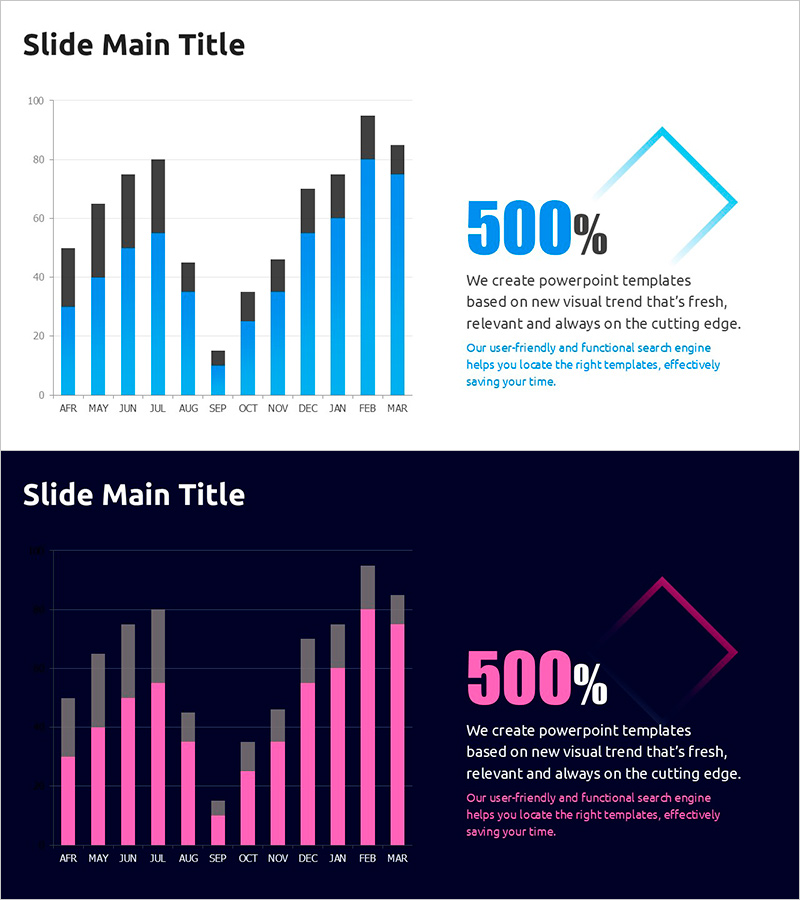
A stacked bar chart PowerPoint slide that visualizes monthly goal achievement progress across a 12-month period (AFR to MAR). Two design variations are provided: a light-tone version with bright background and a dark-tone version with navy background, both using stacked bars to display cumulative data and composition ratios simultaneously. The slide includes 12 monthly data points, a prominent 500% growth rate text, and a diamond arrow icon for emphasis. Fully editable in PowerPoint format (16:9 aspect ratio, PPTX), ready for immediate use in business presentations, performance reports, and data-driven storytelling.
Usage Points
-
Main Usage
Visualize monthly or quarterly goal achievement progress using stacked bars to simultaneously communicate overall trends and component breakdowns. Ideal for performance reports, business results presentations, marketing campaign analysis, and data-driven executive briefings.
-
How to Use
Double-click the bar chart to edit data directly in Excel format and update with your actual figures. Use the light-tone version for bright presentation environments and the dark-tone version for projector settings or dark backgrounds. Customize the 500% text and diamond arrow icon to highlight your key performance metrics.
-
Recommended For
Executive performance reports, quarterly business results presentations, marketing team campaign analysis, sales organization goal tracking, investor presentations on growth metrics, and internal strategy meetings requiring data-backed decision-making.
-
Slide Structure
Two-slide set: Slide 1 features light-tone design (bright background, blue and black stacked bars); Slide 2 features dark-tone design (navy background, pink and gray stacked bars). Each slide contains a 12-month stacked bar chart, 500% growth rate text with diamond arrow icon on the right, and descriptive text area at the bottom.
Related Products
-

Flower and Market Comparison Analysis Chart – Effective Business Strategy
#Business Strategy #Market and Competitor Analysis #Graph
-

Furniture Sales Performance Graph – Business Strategy Achievement
#Business Strategy #Financial Plans and Performance #Graph
-

Visualization of Major Sales Growth Segments – Performance and Strategy
#Business Strategy #Financial Plans and Performance #Graph
-

Visualize Performance with Line Graph Trends – Business Strategy
#Business Strategy #Financial Plans and Performance #Graph
