Detailed Analysis Graphs – Product and Service Differentiation Strategy
RJ0900023_22
- Last Update 08/22/2025
- File Size 0.3MB
- # of Slides 2
- File Format PPTX
- Slide Ratio 16:9
- Color
Keywords
- #Content-Based Slides
- #Design-Based Slides
- #Product/Service Introduction
- #Business Strategy
- #Graph
- #Differentiation Strategy for Products/Services
- #Financial Outlook & Expected Impact
- #Column
- #Column Chart
- #16:9
- #horizontal bar chart PowerPoint
- #numerical comparison slides
- #product differentiation strategy PPT
- #analysis graph presentation
- #competitor comparison slides
About the Product
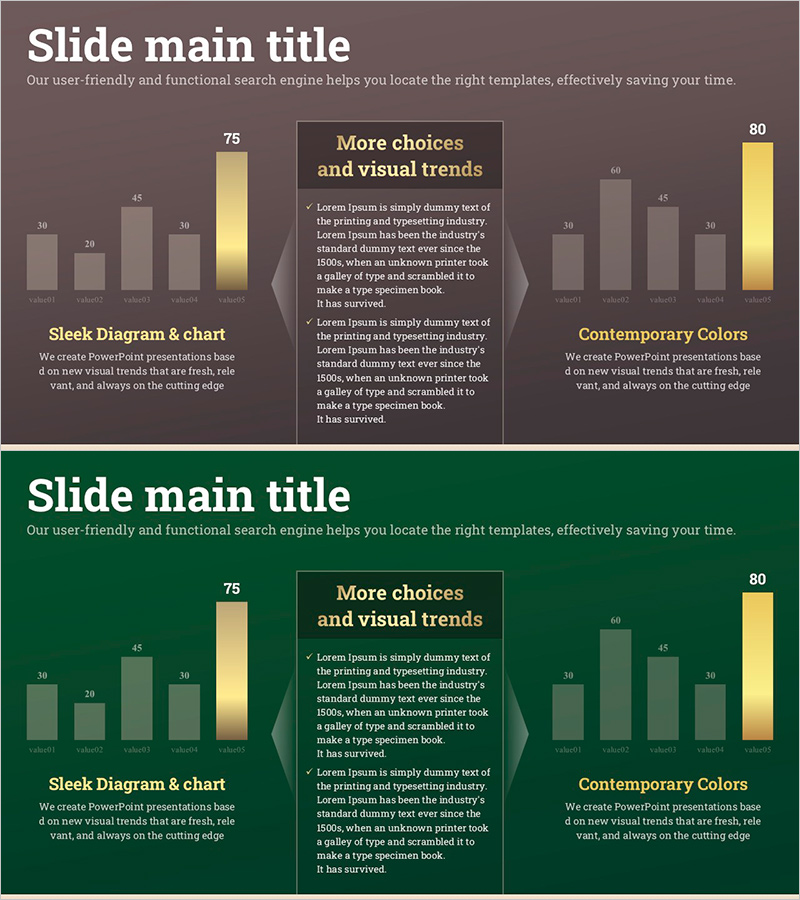
A horizontal bar chart PowerPoint slide designed to visualize product and service differentiation strategy. The slide uses a contrasting gray and gold color scheme to emphasize key metrics, clearly presenting numerical comparisons across five items. With a 2-slide structure, this presentation template is ready to use for market analysis, competitor comparison, performance indicators, and various business scenarios. Available in 16:9 widescreen PPTX format, fully editable in all PowerPoint versions.
Usage Points
-
Main Usage
This slide explains your product or service's competitive advantage through data-driven visualization. The horizontal bar chart compares five key metrics—such as performance indicators, market share, or customer satisfaction—with a gold accent bar highlighting the most critical data point.
-
How to Use
Use this template in business strategy, product introduction, and market analysis sections of your presentation. Slide 1 displays the basic 5-item comparison, while Slide 2 adds explanatory text and insights. Simply input your own data to create a customized business presentation.
-
Recommended For
Marketing managers, sales executives, strategy planners, and product development teams presenting to executives, investors, or clients. Ideal for quarterly performance reports, new product launch presentations, and investor pitch decks.
-
Slide Structure
2-slide set. Slide 1: Horizontal bar chart with 5 items (range 30–75), gray baseline bars with gold accent bars for emphasis. Slide 2: Same chart with right-side text box titled 'More choices and visual trends' for additional context. 16:9 ratio, dark gray background with white typography.
Related Products
-

Target Performance and Expected Results – Visualized with Vertical Bar Charts
#Business Strategy #Graph #Financial Outlook & Expected Impact
-

Flower Wide PPT Vertical Bar Graph – Performance and Expectations
#Business Strategy #Graph #Financial Outlook & Expected Impact
-

Future Outlook Vertical Bar Graph – Business Strategy Analysis
#Business Strategy #Market and Competitor Analysis #Graph
-

Vertical Bar Graph for Vision Growth – Business Development Strategy
#Company Introduction #Business Strategy #Graph
