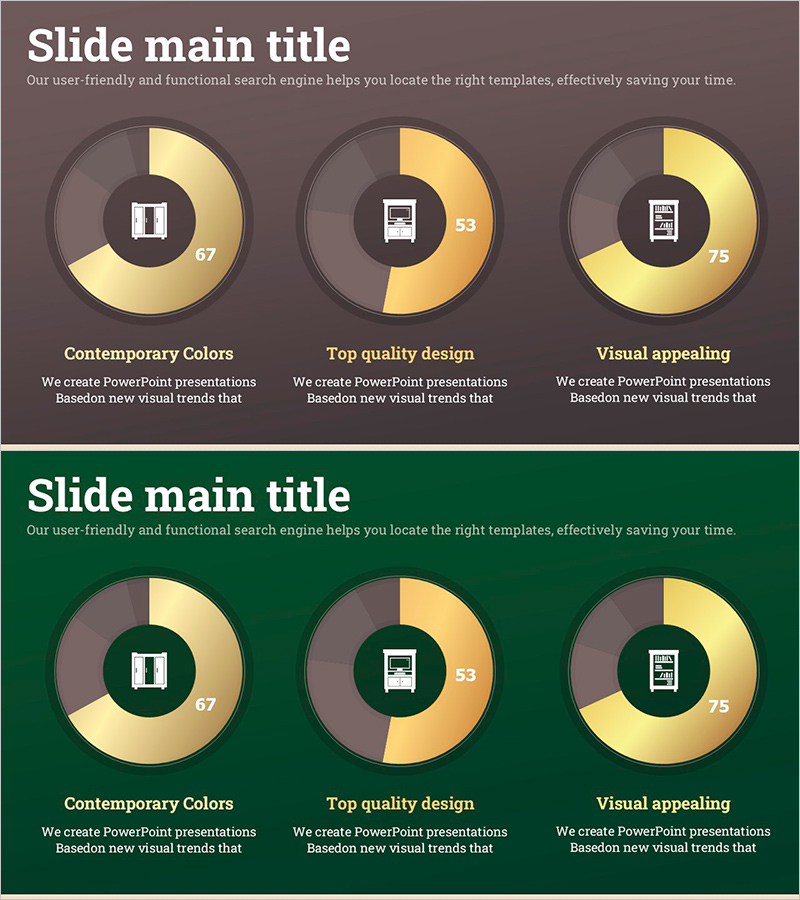
Donut Chart Visualizing Storage Furniture Sales Status
RJ0900023_15
- Last Update 08/22/2025
- File Size 0.3MB
- # of Slides 2
- File Format PPTX
- Slide Ratio 16:9
- Color
Keywords
About the Product
A donut chart PowerPoint slide visualizing sales status across three segments with product icons in the center and percentage values around the ring. This presentation template uses a warm color palette of brown, beige, and yellow tones to display market share, category distribution, and sales composition. The slide structure features a central circular area for product imagery and a surrounding donut ring divided into three segments with numerical data. Ideal for product presentations, marketing analysis, sales reports, and business performance reviews. Includes 2 slides in 16:9 widescreen format, fully editable PPTX file.
Usage Points
-
Main Usage
Visualize sales data, market composition, and category distribution using a donut chart format. The central circular area displays product icons while the surrounding ring segments show numerical values and percentages. Perfect for product introductions, marketing analysis, sales reports, and business performance presentations.
-
How to Use
Open the slide and replace the donut segment values and labels with your actual sales data. Swap the center icon with your product image or company logo. Adjust colors to match your brand palette if needed. Copy and paste the slide into your presentation, report, or proposal document.
-
Recommended For
Sales managers, marketing professionals, business analysts, and executives presenting sales performance, market share, and category breakdown. Particularly suited for furniture retail, consumer goods, distribution, and retail industries presenting quarterly or annual sales analysis.
-
Slide Structure
Two-slide set featuring a 3-segment donut chart as the focal point. Each slide displays a central circular area for product imagery, surrounded by a donut ring divided into three colored segments (brown, beige, yellow) with numerical data points (67, 53, 75). Bottom labels identify each segment's category or metric.
Related Products
-

Logistics Donut Chart – Performance and Market Shares
#Business Strategy #Market and Competitor Analysis #Diagram
-

Camping Tools Infographic Donut Chart – Market Share Analysis
#Market and Competitor Analysis #Graph #Market Status
-

Travel Business Competitor Analysis and Market Share – Doughnut Chart Based
#Market and Competitor Analysis #Graph #Market Share
-

Travel Destination Infographic Market Share – Intuitive Data Visualization
#Market and Competitor Analysis #Graph #Market Share
