Company Key Performance Charts – Importance and Success
RJ0900020_5
- Last Update 08/22/2025
- File Size 7.5MB
- # of Slides 2
- File Format PPTX
- Slide Ratio 16:9
- Color
Keywords
- #Content-Based Slides
- #Design-Based Slides
- #Company Introduction
- #Business Introduction
- #Graph
- #Key Achievements
- #Horizontal Bar
- #Horizontal Bar Chart
- #16:9
- #horizontal bar chart PowerPoint
- #performance comparison slide
- #business metrics chart template
- #data visualization PowerPoint
- #bar graph slide design
- #how to create bar chart in PowerPoint
About the Product
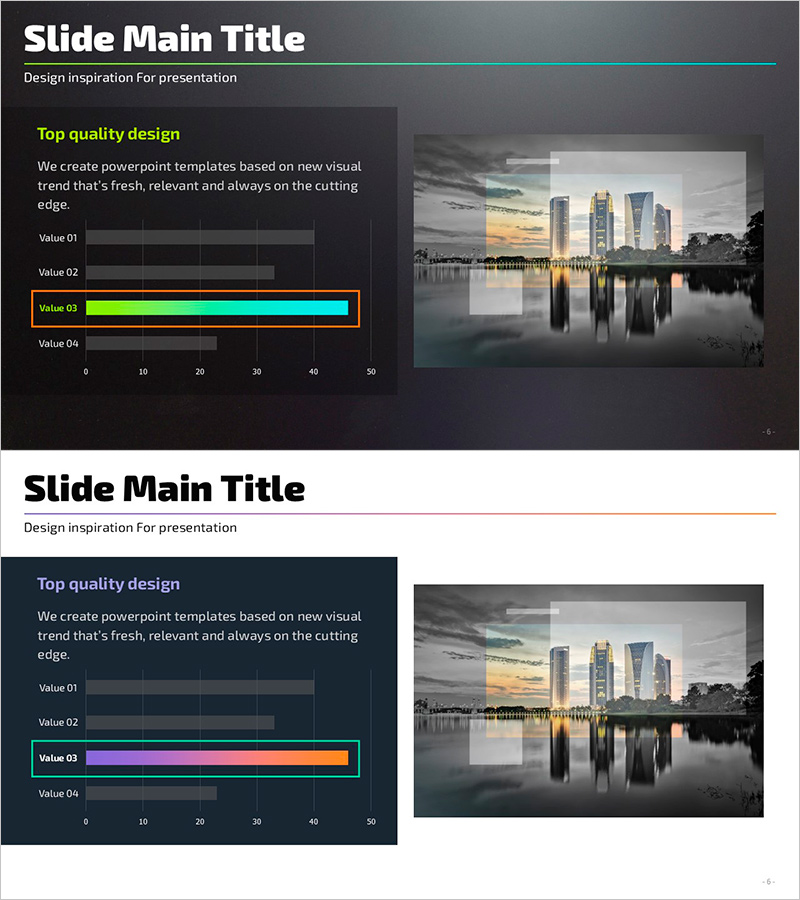
A horizontal bar chart PowerPoint slide designed to visualize key performance indicators and business metrics with clarity and impact. The dark background features neon green, cyan, and orange gradient bars comparing four data values, making it ideal for performance reports, quarterly reviews, and investor presentations. The 2-slide set includes a chart-focused layout and a variant with additional text area for insights. Fully editable in all PowerPoint versions, 16:9 widescreen PPTX format.
Usage Points
-
Main Usage
Optimized for comparing four data points such as revenue, departmental performance, quarterly results, or KPI achievement rates. The high-contrast dark background ensures excellent readability in projection environments, making it ideal for executive briefings, board presentations, investor relations, and performance reviews where quantitative credibility is essential.
-
How to Use
Slide 1 presents the chart standalone for data-focused discussion; Slide 2 positions the chart on the left with a text area on the right for adding interpretation and insights. Double-click the bars to edit values, labels, and colors directly. Customize the neon green, cyan, and orange gradient colors to match your corporate brand identity.
-
Recommended For
CFOs, finance managers, business unit leaders, and marketing executives presenting performance results to senior management, boards, investors, and clients. Particularly effective for quarterly/annual performance reports, new business validation, marketing campaign ROI analysis, departmental KPI comparisons, and data-driven decision-making presentations.
-
Slide Structure
2-slide set. Slide 1: Dark background + 4-item horizontal bar chart (Value 01–04) + 0–50 numeric axis + no legend. Slide 2: Identical chart positioned left + text box area on right. Bars feature neon green (Value 03), cyan, and orange gradient highlighting with numeric labels at bar ends. 16:9 widescreen format.
Related Products
-

Main Business Analysis Graph – Performance Insights
#Company Introduction #Business Introduction #Diagram
-

Comparison Graph of Major Shopping Areas – Market Trends Analysis
#Business Introduction #Market and Competitor Analysis #Graph
-

Website Technology Status Graph – Visualizing Development Status
#Product/Service Introduction #Business Introduction #Graph
-

Business Plan Template Bar Chart
#Business Introduction #Operational Plan #Graph
