Restaurant Company Overview – Modern Graphs Included
RM0100013_4
- Last Update 01/29/2025
- File Size 0.6MB
- # of Slides 2
- File Format PPTX
- Slide Ratio 16:9
- Color
Keywords
- #Content-Based Slides
- #Design-Based Slides
- #Company Introduction
- #Business Introduction
- #Diagram
- #Graph
- #Company Overview
- #Business Overview
- #Cluster
- #Horizontal Bar
- #Closed Cluster Diagram
- #Horizontal Bar Chart
- #16:9
- #horizontal bar chart PowerPoint
- #bar graph slide template
- #company overview presentation
- #data comparison chart
- #business performance slides
About the Product
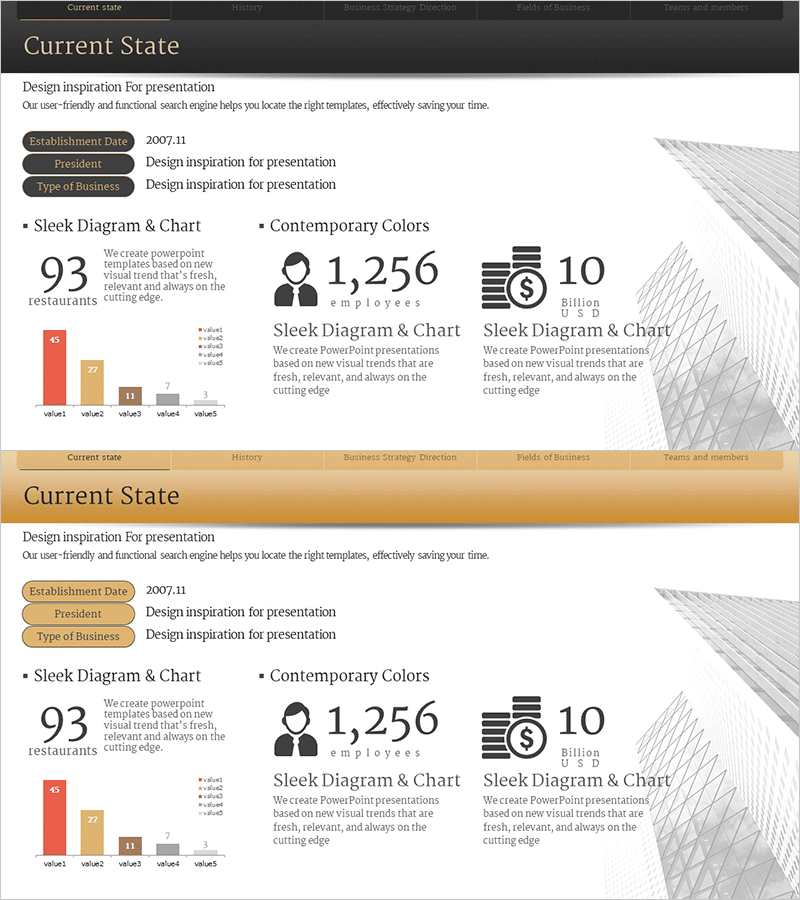
A 2-slide PowerPoint template optimized for restaurant company overview presentations. Features a gray minimalist background with red, orange, and gray horizontal bar charts comparing five key metrics. The first slide displays core indicators—restaurant count, employee count, and revenue—alongside icons and large numerals. The second slide visualizes detailed data through a horizontal bar graph with clear value labels. Ready to use in presentations with easily editable colors and figures.
Usage Points
-
Main Usage
Present core business metrics—revenue, headcount, store locations—in company overview and performance reports. The horizontal bar chart enables quick visual comparison of multiple data points, while icons and text labels enhance information clarity and audience engagement.
-
How to Use
Introduce company basics (founding date, president, business type) and key figures (store count, employees, revenue) on slide 1. Use slide 2's bar chart to explain detailed metrics. Replace all values and labels with your actual data, then deliver as your presentation material.
-
Recommended For
Restaurant and food service company introductions, quarterly/annual performance reports, investor presentations, and employee onboarding materials. Ideal for finance teams, executives, and marketing professionals presenting quantitative results and comparative performance data.
-
Slide Structure
Slide 1: Company name, founding date, president, business type + 3 key metrics (93 restaurants, 1,256 employees, 10 billion USD) displayed with icons and large numerals. Slide 2: Horizontal bar chart with 5 items (value1–value5) using red, orange, and gray color coding. Value labels positioned on the right side of each bar.
Related Products
-

Company Overview and Growth Potential Analysis – Utilizing Diagrams and Graphs
#Company Introduction #Business Introduction #Business Vision and Strategy
-

Company Overview Summary Diagram - Intuitive and Sleek Design
#Company Introduction #Business Introduction #Business Vision and Strategy
-

Company Overview Slide – Diagram for Effective Business Introduction
#Company Introduction #Business Introduction #Diagram
-

Global Enterprise Company Overview – Cluster Design
#Company Introduction #Business Introduction #Diagram
