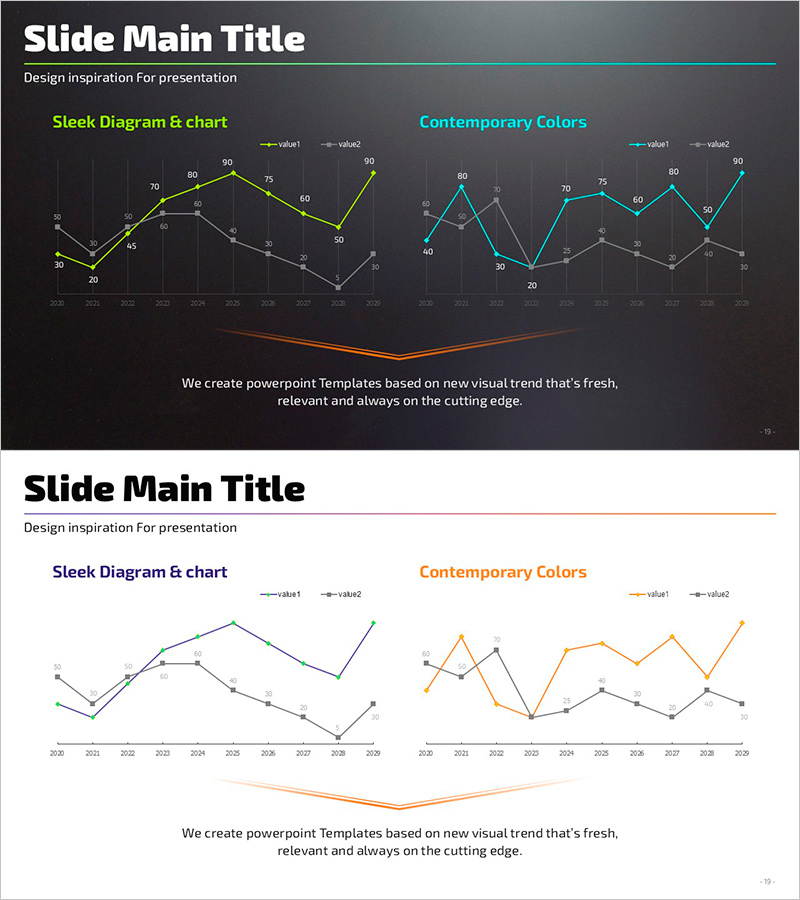
Graph Slide Visualizing Sales Performance Trend – Featuring Contemporary Colors
RJ0900020_18
- Last Update 08/21/2025
- File Size 6.2MB
- # of Slides 2
- File Format PPTX
- Slide Ratio 16:9
- Color
Keywords
About the Product
A line chart PowerPoint slide for visualizing sales performance trends with dual data series. The 2-slide set features contemporary color schemes: the first slide uses lime and cyan tones, while the second employs orange and gray accents. Both slides display identical chart structures with X-axis spanning 2010–2030 and Y-axis ranging 0–90, with data point values labeled for precision. Formatted in 16:9 widescreen PPTX, fully editable and ready to use. Ideal for presenting time-series comparisons such as sales volume, revenue, customer count, or market performance metrics in business reports and investor presentations.
Usage Points
-
Main Usage
Clearly visualizes numerical trends over time, such as sales volume, revenue, or customer metrics. The dual-series format enables direct comparison of two indicators, revealing correlations and differences at a glance. Data point labels ensure accurate value communication.
-
How to Use
Apply to quarterly or annual sales reports, business performance presentations, marketing effectiveness analyses, and financial reviews. Simply input your data and it auto-populates the chart. Choose between two color variations to match your presentation's tone and branding.
-
Recommended For
Sales and marketing teams presenting performance metrics, executive-level business reviews, investor pitch decks, and analytical reports. Particularly suited for financial analysis, revenue tracking, and comparative performance assessments requiring dual-metric visualization.
-
Slide Structure
2-slide set. Each slide contains a dual-series line chart with X-axis (2010–2030) and Y-axis (0–90 range), with data point values displayed. First slide features lime and cyan colors; second uses orange and gray tones. Identical structure across both slides provides color scheme flexibility.
Related Products
-

Competitor Comparison Analysis Graph - Optimized for Market and Competitor Analysis
#Market and Competitor Analysis #Graph #Competitor Analysis
-

Triangular Prism Graph for Visualizing Market Status – Insights and Analysis
#Market and Competitor Analysis #Graph #Other
-

Key Personnel Work Competency Assessment Slide - Customer Analysis and Manpower
#Company Introduction #Market and Competitor Analysis #Diagram
-

Competitor Idea Analysis Graph
#Market and Competitor Analysis #Graph #Competitor Analysis
