Company Overview and Growth Potential Analysis – Utilizing Diagrams and Graphs
RM0500002_4
- Last Update 02/20/2025
- File Size 4.3MB
- # of Slides 2
- File Format PPTX
- Slide Ratio 16:9
- Color
Keywords
- #Content-Based Slides
- #Design-Based Slides
- #Company Introduction
- #Business Introduction
- #Business Vision and Strategy
- #Diagram
- #Graph
- #Company Overview
- #Business Overview
- #Cluster
- #Horizontal Bar
- #Closed Cluster Diagram
- #Horizontal Bar Chart
- #16:9
- #company overview PowerPoint
- #growth potential presentation
- #horizontal bar chart slide
- #business presentation template
- #corporate introduction slide
About the Product
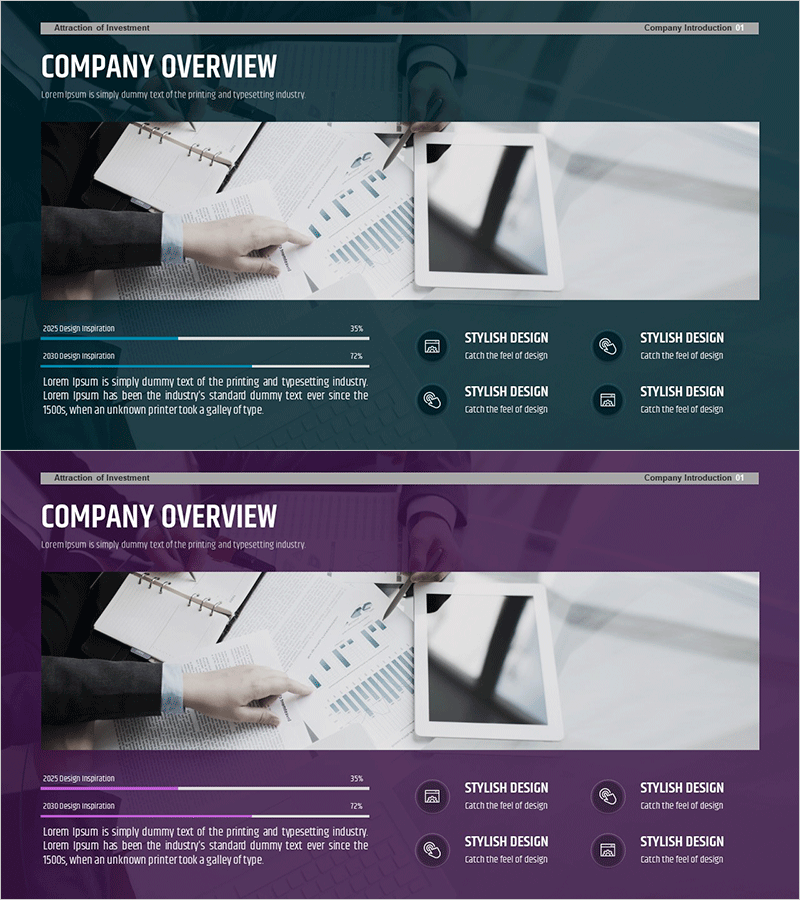
A professional 2-slide PowerPoint presentation set designed to communicate company overview and growth potential effectively. Features a dark teal background with white typography in a minimalist layout that emphasizes corporate credibility. The first slide presents company information with a business image and key details in a two-column structure, complemented by four icon-based text boxes on the right side. The second slide visualizes growth metrics using a dual-series horizontal bar chart, enabling clear numerical comparison and trend analysis. Delivered in 16:9 widescreen PPTX format compatible with all presentation environments, with fully editable colors and text fields for immediate customization.
Usage Points
-
Main Usage
Introduces company information and core values in the overview section, while analyzing growth metrics through data-driven comparison in the potential section. Ideal for investor presentations, employee onboarding, partner meetings, and corporate communications requiring professional visual impact.
-
How to Use
Insert company photo or team image in the first slide's image area, then populate text boxes with company name, founding year, employee count, and business focus. Update the horizontal bar chart data on the second slide with actual growth figures representing revenue, customer base, market share, or other key performance indicators.
-
Recommended For
Executives, business development teams, marketing professionals, and investor relations specialists presenting company status and growth trajectory. Particularly effective for startup pitch decks, SME investment presentations, new business proposals, and partnership negotiation materials.
-
Slide Structure
Slide 1: Company Overview – Left-side wide image area (approximately 60% width) + right-side text information (company name and description) + bottom row of four icon-based text boxes with category labels. Slide 2: Growth Potential Analysis – Title section + dual-series horizontal bar chart (5–6 comparison items) + descriptive text footer. Full 16:9 widescreen format with dark teal and purple background options.
Related Products
-

Company Overview Summary Diagram - Intuitive and Sleek Design
#Company Introduction #Business Introduction #Business Vision and Strategy
-

Joint Business Overview – Business Strategy and Organization Chart
#Company Introduction #Business Introduction #Business Vision and Strategy
-

Business Overview Diagram – Effective Cluster Design for Business Introduction
#Company Introduction #Business Introduction #Business Vision and Strategy
-

Overview of Key Business Services – Dynamism and Innovation
#Company Introduction #Business Introduction #Business Vision and Strategy
