Measurement Graph Slide – Market Analysis and Future Outlook
RJ0900019_24
- Last Update 08/21/2025
- File Size 2.3MB
- # of Slides 2
- File Format PPTX
- Slide Ratio 16:9
- Color
Keywords
About the Product
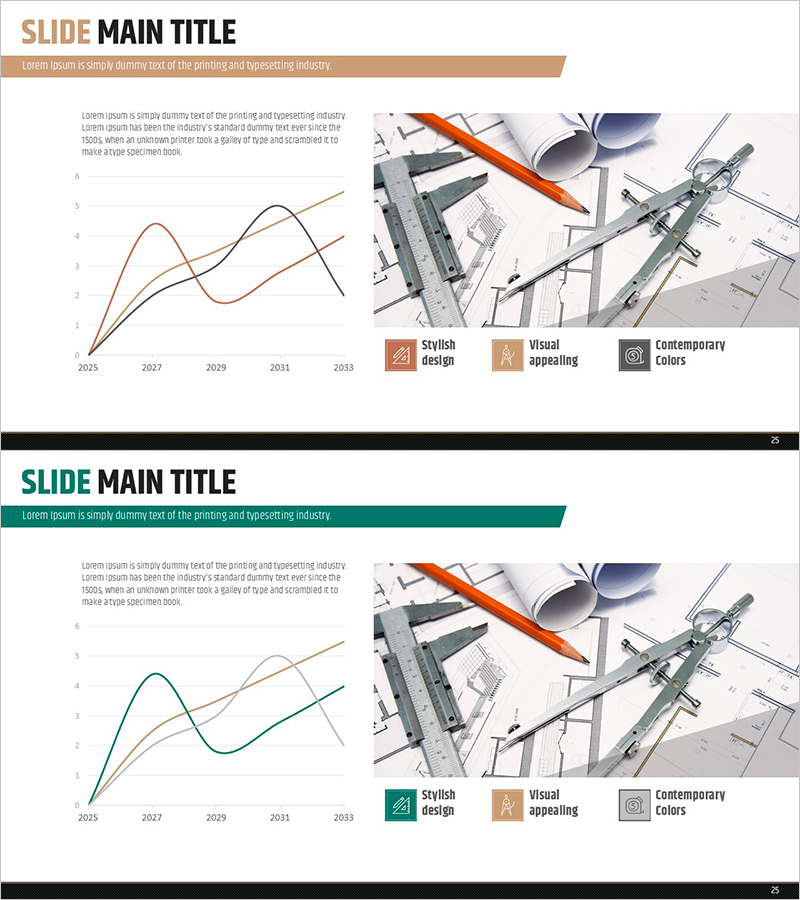
A 2-slide PowerPoint presentation template for visualizing market analysis and future outlook. The left side features a multi-line graph showing trends from 2025 to 2033, while the right side displays design tools imagery with three key attributes (stylish design, visual appeal, contemporary colors) highlighted by icons. The beige header and teal accent color create a cohesive layout perfect for presenting quantitative data such as competitive analysis, market trends, and growth forecasts. This slide template enables you to communicate market insights persuasively in business presentations, investor pitches, and strategic reports.
Usage Points
-
Main Usage
This slide expresses market conditions and future growth projections through quantitative data visualization. The multi-line graph enables simultaneous comparison of multiple indicators over time, communicating market opportunities and risks visually. It supports data-driven persuasion in presentations to investors, partners, and stakeholders.
-
How to Use
Input actual market data (revenue, market share, growth rate, etc.) into the left graph area, and place relevant images or icons in the right section. Write your analysis topic in the header text (e.g., market size trends, competitor performance comparison), then adjust the legend and axis labels to match your data. The 16:9 widescreen format is optimized for projectors and monitor displays.
-
Recommended For
Recommended for teams responsible for market analysis sections in business plans, investor presentations, marketing strategies, and market research reports. Ideal for strategy, marketing, finance, and executive teams who need credible data visualization for decision-making and external presentations.
-
Slide Structure
Two-slide layout with each slide divided into left and right halves. Left side contains a multi-line graph with Y-axis values, X-axis years, and legend. Right side includes one text input area and one image placement area. A beige header bar at the top holds the title, and three attribute icons (design, visual appeal, color) are positioned at the bottom.
Related Products
-

Line Charts for Design Tasks – Market and Competitor Analysis
#Market and Competitor Analysis #Graph #Future Outlook
-

A Bar Graph Showing Future Prospects
#Market and Competitor Analysis #Graph #Future Outlook
-

Visualizing Business Strategy with Bar Charts – Market Analysis and Future Outlook
#Market and Competitor Analysis #Diagram #Graph
-

Market Outlook Donut Chart – Vision for the Future
#Market and Competitor Analysis #Graph #Future Outlook
