Food Ingredient Characteristics Radar Chart – Features and Benefits
RJ0800013_8
- Last Update 08/03/2025
- File Size 0.4MB
- # of Slides 2
- File Format PPTX
- Slide Ratio 16:9
- Color
Keywords
- #Content-Based Slides
- #Design-Based Slides
- #Product/Service Introduction
- #Diagram
- #Graph
- #Features
- #Benefits and Advantages
- #Cluster
- #Other
- #Closed Cluster Diagram
- #Radar Chart Spider Chart
- #16:9
- #radial radar chart PowerPoint
- #food ingredient characteristics slide
- #5-axis diagram template
- #radar chart slide design
- #data visualization PowerPoint
About the Product
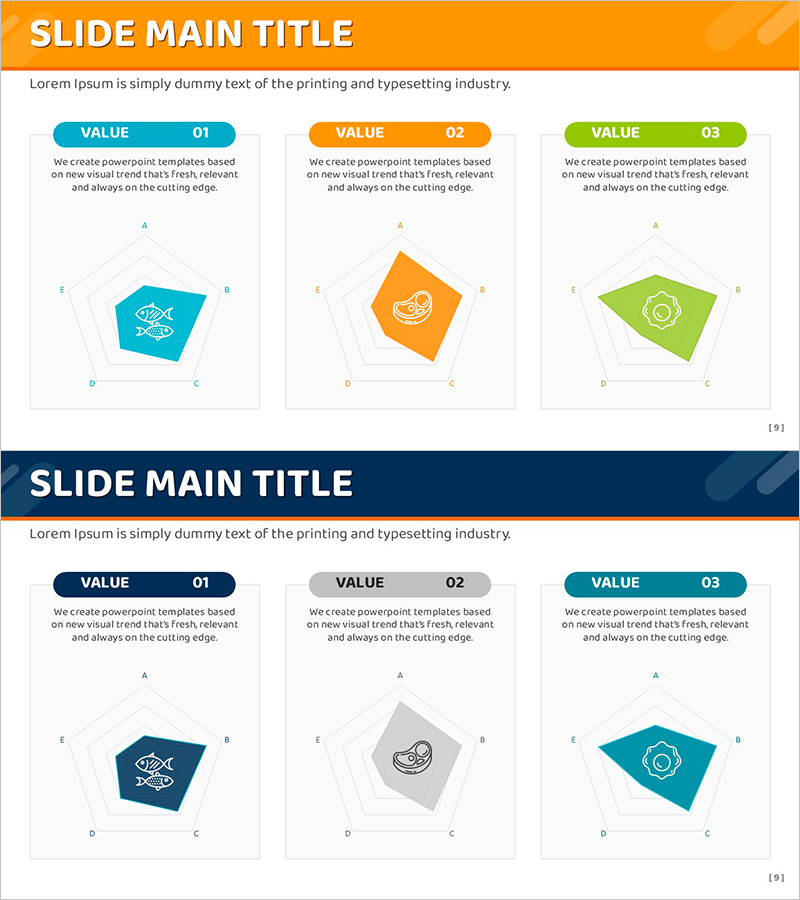
A radial radar chart PowerPoint slide that visualizes food ingredient characteristics and benefits across five axes. Three color-coded polygons in teal, orange, and green distinctly represent each ingredient's profile, with VALUE 01–03 labels and supporting icons for enhanced clarity. The 2-slide set is ready for immediate use in comparative ingredient analysis presentations. Delivered in 16:9 widescreen PPTX format compatible with all presentation environments.
Usage Points
-
Main Usage
Designed to compare five key ingredient attributes—nutrition, flavor, freshness, price, and health benefits—across a radial axis system. Instantly reveals strengths and weaknesses of each ingredient, making it ideal for product presentations, marketing materials, and nutritional education.
-
How to Use
Replace VALUE 01–03 labels with ingredient names and input numerical values on the five axes; the polygon shape auto-adjusts. Retain the teal, orange, and green color scheme or customize to brand colors. Icons can be swapped to match specific ingredients.
-
Recommended For
Food and beverage company product launches, nutritionist and culinary instructor educational content, agricultural distributor comparative analysis, health food marketing presentations, and ingredient supplier sales pitches.
-
Slide Structure
2-slide deck. Each slide features an orange header bar, three card sections with color-coded VALUE labels, descriptive text, a 5-axis radial radar chart polygon, and supporting icons. Optimized for 16:9 widescreen displays and large projection screens.
Related Products
-

Visualizing Features and Benefits with Radial Charts
#Product/Service Introduction #Diagram #Graph
-

Characteristics of Organic Products
#Product/Service Introduction #Diagram #Features
-

Denim PPT Keyword Box
#Product/Service Introduction #Operational Plan #Diagram
-

Introduction to the Main Characteristics of the Project – Features and Benefits
#Product/Service Introduction #Diagram #Features
