Facilities Manpower Operation Plan Slide – Efficient Business Management
RJ0900017_25
- Last Update 08/20/2025
- File Size 0.3MB
- # of Slides 2
- File Format PPTX
- Slide Ratio 16:9
- Color
Keywords
- #Content-Based Slides
- #Design-Based Slides
- #Business Management
- #Diagram
- #Project Organization and Roles and Responsibilities
- #Quality Assurance Plan
- #Table
- #16:9
- #facilities manpower operation PPT slide
- #operation plan PowerPoint table
- #business management slide
- #how to create facilities plan in PowerPoint
- #manpower operation presentation
About the Product
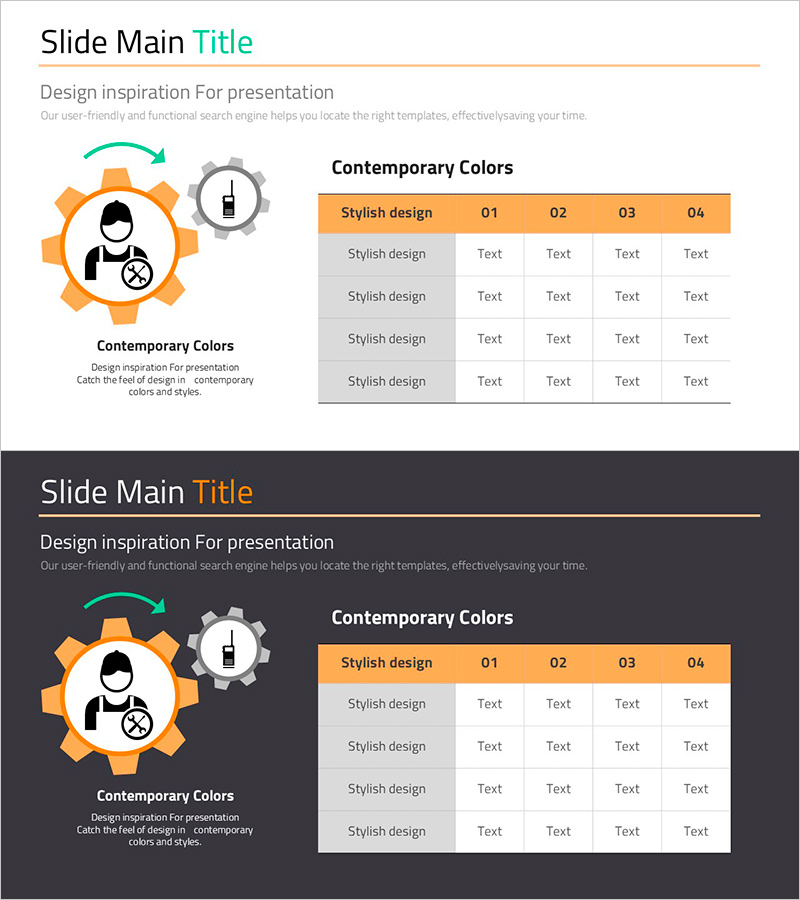
A PowerPoint slide template for organizing facilities and manpower operation plans efficiently. This 2-slide presentation features an orange header and gray data area, designed for business management and quality assurance phases to visualize operational strategies. The left icon section and right comparison table clearly communicate information, with ample text input space for immediate use. Perfect for presentations, business reports, and operational slideshows.
Usage Points
-
Main Usage
Present facilities and manpower operation plans in a structured table format to emphasize business management efficiency. The two-column layout with left icons and right data table simultaneously conveys concepts and specific metrics, providing clear decision-making support.
-
How to Use
Use in business plans, operational reports, and strategy presentations to explain facilities investment and manpower deployment strategies. Input key concepts in the left icon area and monthly or quarterly operation schedules and personnel information in the right table to visualize operational systems.
-
Recommended For
Operations managers, business planners, and quality assurance teams explaining facilities investment and manpower strategies to executives and investors. Highly effective in manufacturing, construction, and service industries where operational planning is critical.
-
Slide Structure
2-slide format with each slide featuring a left icon area for concept explanation and a right 4-column data table for numeric and schedule input. Orange headers and alternating gray-white data rows ensure readability, with generous text input space throughout.
Related Products
-

Introducing the Quality Assurance Plan Schedule
#Business Management #Diagram #Implementation Schedule
-

Workload and Schedule Table – Efficient Task Management
#Product/Service Introduction #Business Management #Diagram
-

Brown Orange Primary Table Chart – Business Management and Organizational Planning
#Business Management #Operational Plan #Diagram
-

4 STEP Quality Assurance Plan Slide
#Business Strategy #Business Management #Diagram
