3 Competitive Advantage Graphs – Market and Competitor Analysis
RJ0900001_9
- Last Update 08/15/2025
- File Size 0.2MB
- # of Slides 2
- File Format PPTX
- Slide Ratio 16:9
- Color
Keywords
About the Product
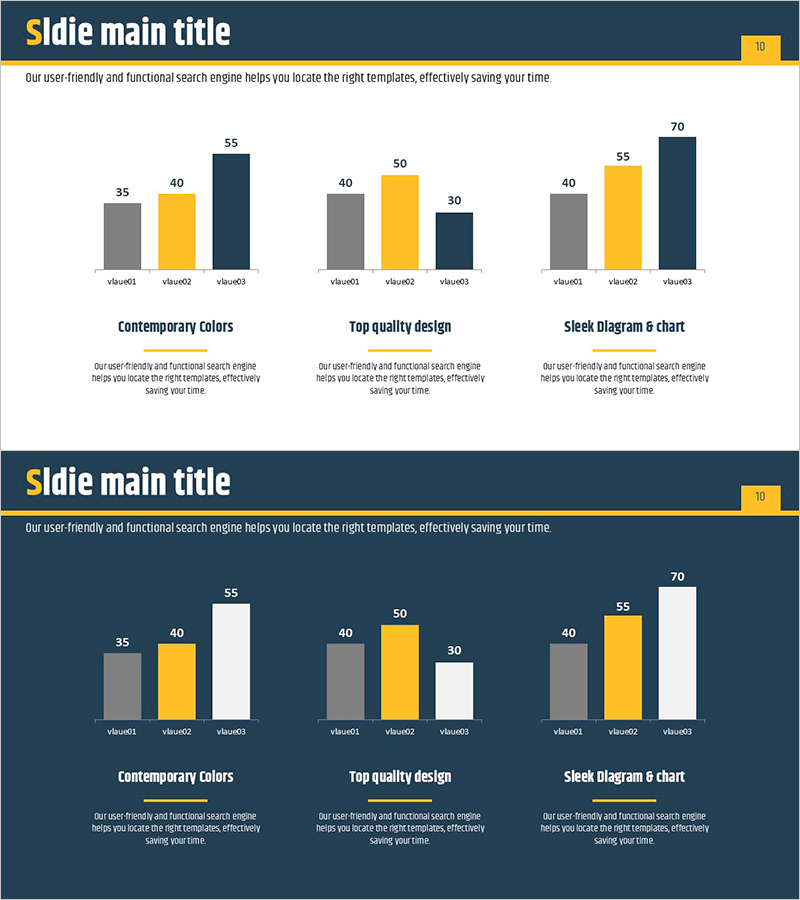
A comprehensive PowerPoint slide set featuring three bar chart variations for competitive analysis and market positioning. The slides include horizontal and vertical bar graphs in gray, yellow, and navy color schemes, each displaying 3–5 data points for clear numerical comparison. Designed for business reports, competitive analysis presentations, and strategic planning documents, these charts enable quick data visualization and immediate insertion into your presentation flow. The 16:9 format spans 2 slides for seamless integration.
Usage Points
-
Main Usage
Communicate competitive positioning, market share analysis, and strategic advantages through multi-angle data visualization. The three distinct bar chart structures present the same dataset from different perspectives, enhancing audience comprehension and decision-making.
-
How to Use
Insert into market analysis sections of business reports, executive briefings, and investor pitch decks. Edit the numerical values and labels to match your competitive data, then present immediately without additional design work.
-
Recommended For
Marketing managers, executives, business strategists, and consultants analyzing market dynamics and competitive positioning. Ideal for quarterly performance reports, new business proposals, and investor relations presentations.
-
Slide Structure
2-slide deck with Slide 1 containing three horizontal bar chart sets (3 items each) and Slide 2 featuring three vertical bar chart sets (3 items each). All charts use gray, yellow, and navy color differentiation with data labels and legends included.
Related Products
-

Color Highlight Vertical Bar Graph – Market Competition Analysis
#Market and Competitor Analysis #Graph #Competitor Analysis
-

Competitor Comparison Analysis Bar Graph
#Market and Competitor Analysis #Graph #Competitor Analysis
-

Comparative Analysis 3D Cylinder Bar Graph – Market and Competitor Analysis
#Market and Competitor Analysis #Graph #Competitor Analysis
-

Competitor Analysis Bar Graph – Enhancing Market Insights
#Market and Competitor Analysis #Graph #Competitor Analysis
