Pie Chart and Chopa Illustration – Market Analysis Slide
RJ0900016_6
- Last Update 08/20/2025
- File Size 0.1MB
- # of Slides 2
- File Format PPTX
- Slide Ratio 16:9
- Color
Keywords
- #Content-Based Slides
- #Design-Based Slides
- #Market and Competitor Analysis
- #Financial Plans and Performance
- #Graph
- #Industry Trends
- #Sales and Revenue
- #Circles
- #Pie Chart
- #16:9
- #pie chart PowerPoint slide
- #circular graph presentation
- #market analysis chart
- #revenue composition visualization
- #data visualization slide template
About the Product
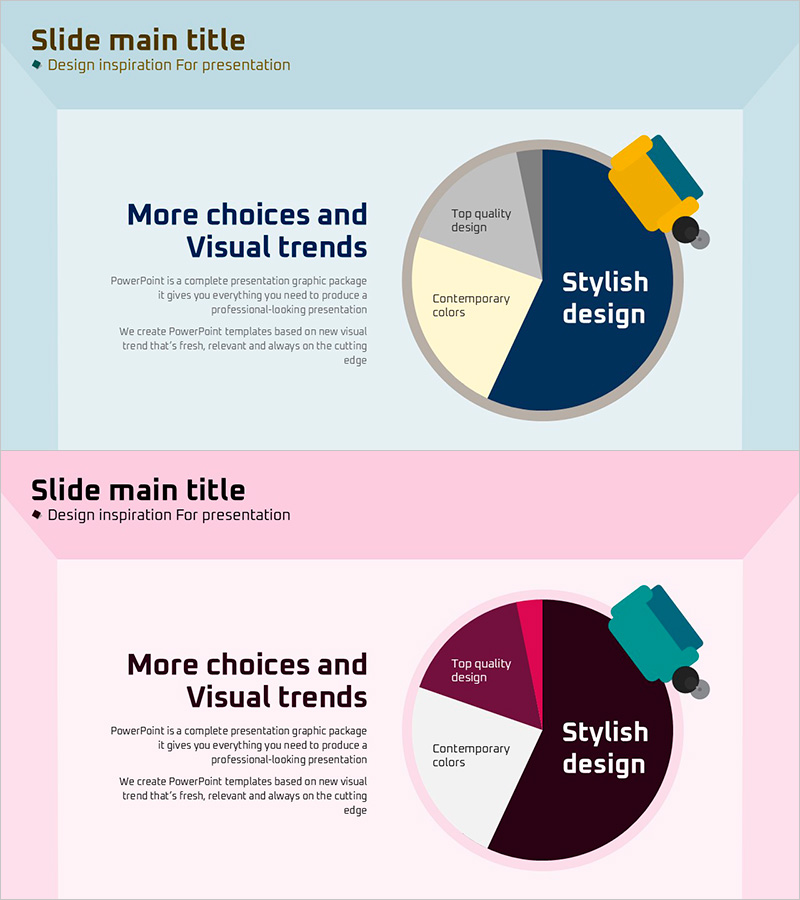
A 3-segment pie chart PowerPoint slide designed to visualize market analysis and revenue composition data. Set against a light blue background, the circular chart uses navy, beige, and gray tones to clearly represent proportional data, with a 3D accent element in the upper right corner providing visual emphasis. The left text area accommodates title and descriptive content for clear information hierarchy. This presentation slide is ready to use for financial planning, business reports, and marketing presentations where composition ratios need explanation. The 2-slide set adapts to various data scenarios.
Usage Points
-
Main Usage
Optimized for expressing proportional relationships such as market share, revenue composition, cost allocation, and customer distribution through circular chart visualization. Supports data-driven decision-making in financial analysis, business status reporting, and marketing performance presentations.
-
How to Use
Enter analysis title and description in the left text area, then input corresponding item names and values in each pie chart segment. Colors and legend can remain as designed or be customized to match corporate branding, while the 3D accent element highlights important items when needed.
-
Recommended For
Recommended for finance teams, marketing departments, and executive reporting. Effective in business plans, quarterly performance reports, investor presentations, and client proposals where composition ratios must be communicated intuitively.
-
Slide Structure
2-slide set with light blue background, left text area (title and description), and right 3-segment pie chart (navy, beige, gray tones). A 3D accent element in the upper right provides visual emphasis. Optimized for 16:9 widescreen format in modern presentation environments.
Related Products
-

Spring Pastel Wide PowerPoint Template Pie Chart
#Business Strategy #Financial Plans and Performance #Graph
-

Stacked Bar Graph by Year with Detailed Breakdown - Market Analysis Insights
#Market and Competitor Analysis #Financial Plans and Performance #Graph
-

Investment and Revenue Projection Strategy Slide
#Financial Plans and Performance #Graph #Projected Return on Investment (ROI)
-

Hand Shape Market Trends and Sales Revenue – Practical Graph Slide
#Market and Competitor Analysis #Financial Plans and Performance #Graph
