Construction Receivable Trend Graph – Clear Data Comparison
RJ0900011_12
- Last Update 08/18/2025
- File Size 0.3MB
- # of Slides 2
- File Format PPTX
- Slide Ratio 16:9
- Color
Keywords
About the Product
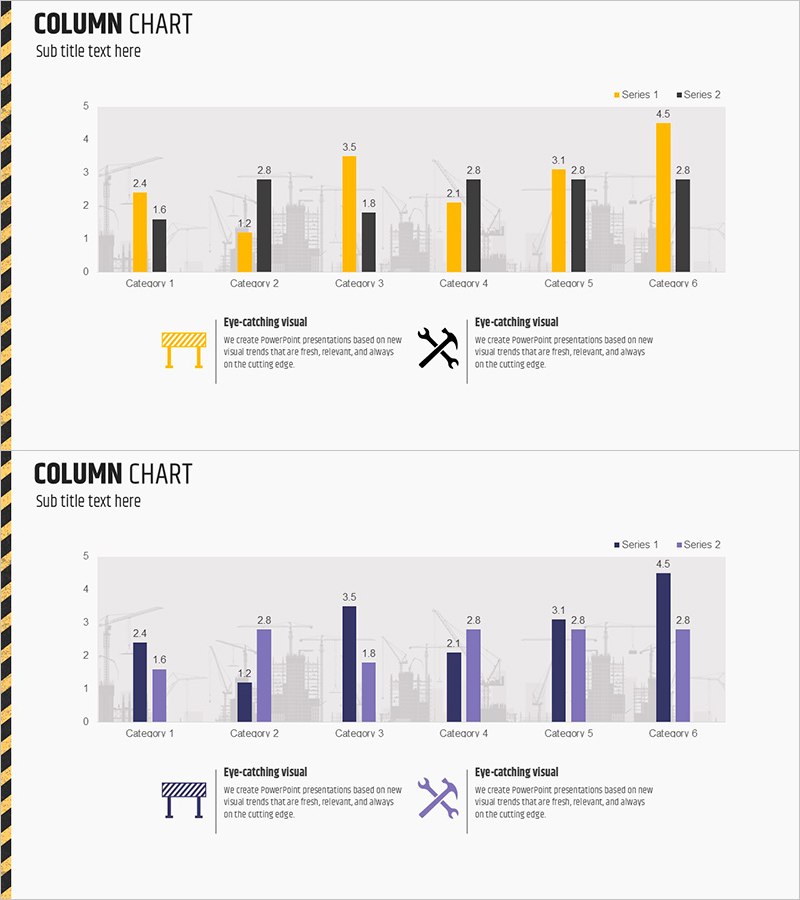
A grouped column chart PowerPoint slide designed to visualize financial data such as construction receivables trends with clear comparative analysis. The slide displays 6 categories with 2 data series positioned side-by-side, enabling simultaneous comparison across items and between series. Yellow and black color schemes create strong contrast, while a cityscape background reinforces business context. The lower section includes icons and descriptive text to highlight key insights. This 16:9 widescreen 2-slide set is ready for immediate editing and presentation use.
Usage Points
-
Main Usage
Compares multiple items across 2 data series—such as financial performance, sales figures, or construction receivables—in a single view. Column heights intuitively represent numerical values, while color differentiation clearly distinguishes between series.
-
How to Use
Ideal for business reports, financial analysis presentations, marketing performance reviews, and construction/real estate project status updates. Edit column heights and colors to input your actual data. Customize category labels and series names to match your specific metrics.
-
Recommended For
Finance teams, sales departments, project managers, construction and real estate professionals, and executives presenting quantitative data. Particularly effective for quarterly or monthly comparative analysis presentations.
-
Slide Structure
Slide 1: Grouped column chart with 6 categories (Category 1–6) on X-axis and 0–5 numerical range on Y-axis. Yellow Series 1 and black Series 2 bars positioned side-by-side for each category, with legend and data labels. Slide 2: Identical chart structure using dark-toned colors (navy and light blue) to provide alternative color scheme option.
Related Products
-

Infrastructure and Regional Marketing Strategies – Data Visualization Template
#Company Introduction #Business Introduction #Graph
-

Financial Status Analysis Chart – Business Introduction and Future Insights
#Business Introduction #Market and Competitor Analysis #Diagram
-

Comparison Bar Graphs and Core Doughnut Charts – Performance Analysis
#Business Introduction #Business Strategy #Graph
-

Origami Presentation Template Vertical Bar Chart – Visualize Your Business Performance
#Business Introduction #Financial Plans and Performance #Graph
