Comparison Bar Graphs and Core Doughnut Charts – Performance Analysis
RJ0500041_26
- Last Update 06/18/2025
- File Size 0.2MB
- # of Slides 2
- File Format PPTX
- Slide Ratio 16:9
- Color
Keywords
- #Content-Based Slides
- #Design-Based Slides
- #Business Introduction
- #Business Strategy
- #Graph
- #Achievements
- #Column
- #Circles
- #Grouped Column
- #Doughnut Chart
- #16:9
- #doughnut chart PowerPoint slide
- #pie chart comparison template
- #bar graph presentation
- #performance analysis slide
- #data visualization template
- #ratio chart download
About the Product
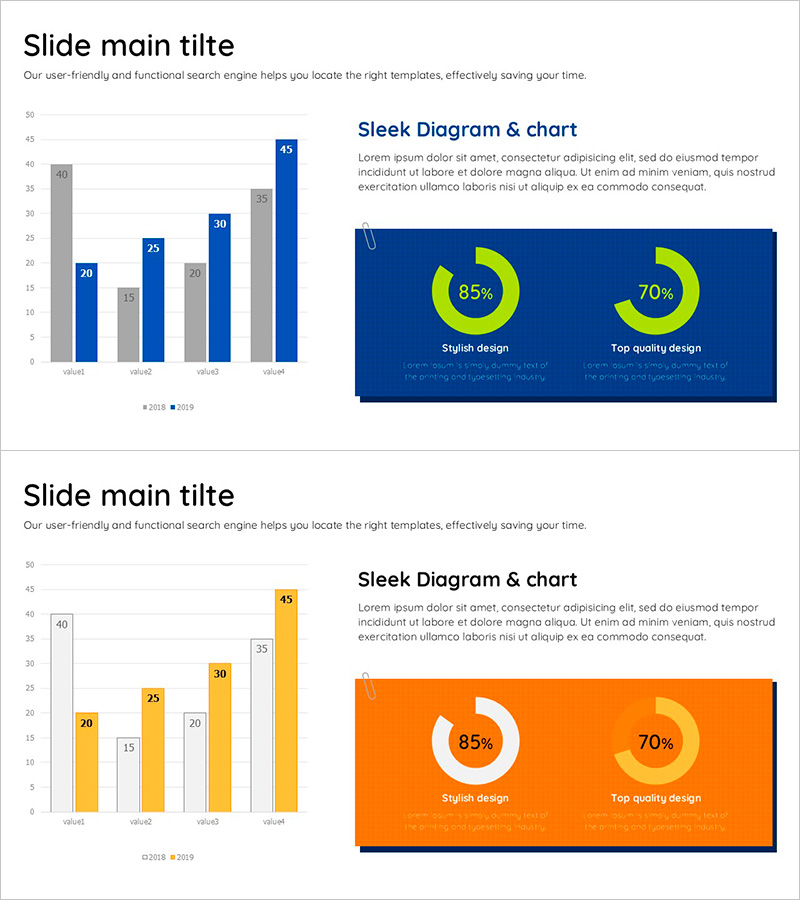
A 2-slide set optimized for performance analysis and business strategy presentations. The left side features a vertical bar graph comparing four data points across two series, while the right side displays a doughnut chart visualizing two key metrics as percentages. Two color variations are included: a dark blue background with lime-green doughnut and white text, and an orange background with white doughnut. The PowerPoint slides are in 16:9 widescreen PPTX format and fully editable, making them ideal for business introduction, performance reporting, and strategic initiative sections where data-driven insights need emphasis.
Usage Points
-
Main Usage
Visualizes quantitative performance data and business strategy metrics during presentations. The bar graph clearly compares multiple data points while the doughnut chart emphasizes key percentage metrics, enhancing audience comprehension of business performance.
-
How to Use
Input actual numerical data into the left bar graph and corresponding percentage values into the right doughnut chart. Select either the dark blue or orange background version to match your presentation's overall design tone and maintain visual consistency throughout.
-
Recommended For
Recommended for executives, business managers, and marketing teams presenting quantitative performance results. Particularly effective for quarterly or annual performance reports, business strategy explanations, and investor pitch decks where data credibility is essential.
-
Slide Structure
Slide 1: Dark blue background with 4-item vertical bar graph (2-series comparison) and 2-metric lime-green doughnut chart (85%, 70% indicators) side-by-side. Slide 2: Orange background with identical bar graph structure and white doughnut chart. Each slide includes title area and legend for independent use.
Related Products
-

Social Network Business Analysis – Vertical Bar Chart
#Business Introduction #Business Strategy #Graph
-

Doughnut Chart Slide for Analyzing Technology Data
#Business Introduction #Business Strategy #Graph
-

Donut Chart for Business Strategy Visualization – Performance-Focused Marketing
#Business Introduction #Business Strategy #Marketing Plan and Strategy
-

Premium Management Template with Donut Chart for Performance Visualization
#Business Introduction #Business Strategy #Graph
