Derived Results by Radar Chart – Market and Competitor Analysis
RJ0800004_15
- Last Update 07/31/2025
- File Size 0.1MB
- # of Slides 2
- File Format PPTX
- Slide Ratio 16:9
- Color
Keywords
- #Content-Based Slides
- #Design-Based Slides
- #Product/Service Introduction
- #Market and Competitor Analysis
- #Graph
- #Features
- #Market Analysis
- #Other
- #Radar Chart Spider Chart
- #16:9
- #radar chart PowerPoint
- #radial chart template
- #5-item comparison slide
- #market analysis presentation
- #competitor analysis PPT
- #radar diagram slide download
- #how to create radar chart in PowerPoint
About the Product
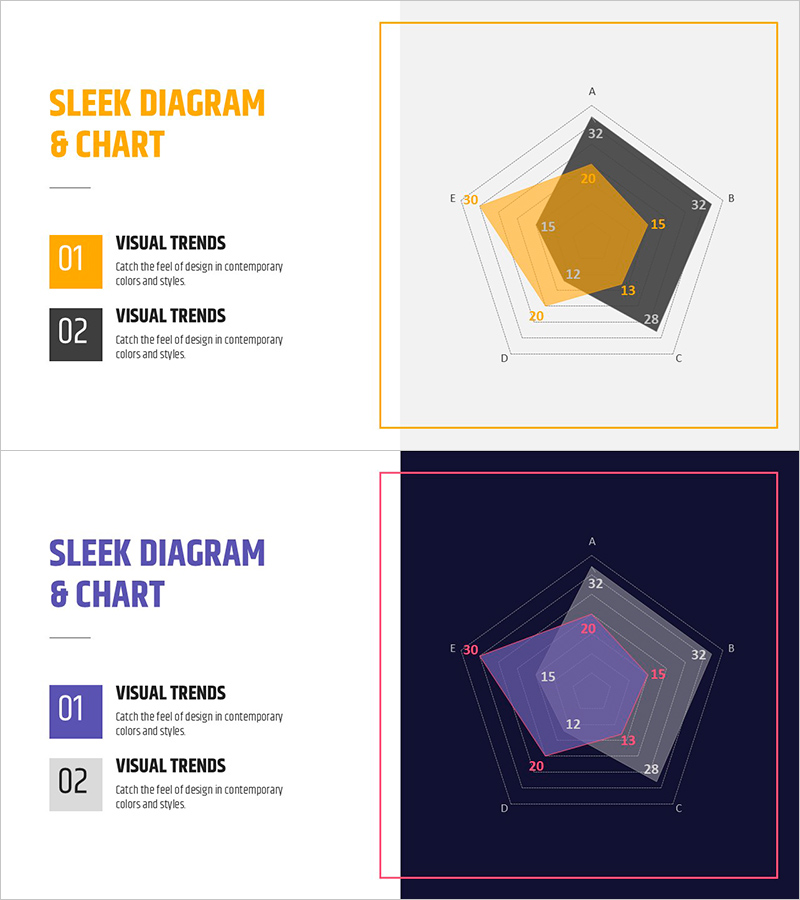
A 2-slide PowerPoint template featuring a 5-node radial radar chart for comparative analysis across multiple dimensions. The first slide uses an orange and dark gray two-tone color scheme on a light background, while the second slide features a deep navy background with purple accent colors. Both slides contain fully editable radar charts with five axes (A, B, C, D, E) for data input, making them ideal for market research findings, competitive capability assessment, product feature evaluation, and strategic positioning analysis. Delivered in 16:9 widescreen PPTX format with ready-to-use structure.
Usage Points
-
Main Usage
Visualizes five-dimensional data in radial format to enable intuitive comparative analysis and identify strengths and weaknesses across multiple criteria. Ideal for market research presentations, competitive benchmarking, product feature comparison, organizational capability assessment, and any scenario requiring multidimensional quantitative comparison.
-
How to Use
Enter item names and numerical values into the five axes (A–E) on each slide, and the radial area automatically forms. Use the first slide with bright orange accents for positive-framed analysis and the second slide with purple accents for in-depth analytical presentations. All colors and values are fully customizable.
-
Recommended For
Marketing professionals conducting market positioning analysis, strategy teams preparing competitive analysis reports, product development teams presenting feature comparisons, executive briefings, consulting proposals, academic research presentations, and business intelligence dashboards.
-
Slide Structure
2-slide set. Slide 1: Light gray background with orange (#F5A623) and dark gray (#4A4A4A) two-tone radial chart, five axis labels, and data input fields. Slide 2: Deep navy background (#1A1F3A) with purple accent (#9B7FBA) radial chart using identical five-axis structure. Both slides include title and description text areas on the left side for context and interpretation.
Related Products
-

Business Direction Radial Chart – Market and Competitive Analysis
#Product/Service Introduction #Market and Competitor Analysis #Graph
-

Radar Chart Analysis Results – Market and Competitor Insights
#Product/Service Introduction #Market and Competitor Analysis #Graph
-

Real Estate Analysis Charts by Consumer Characteristics – Graphs for Market Insights
#Product/Service Introduction #Market and Competitor Analysis #Graph
-

Radial Graph for Indoor Lighting Effect Analysis – Modern Approach
#Product/Service Introduction #Market and Competitor Analysis #Marketing Plan and Strategy
