Line Graph with Sales Change – Competitor Advantage Analysis
RJ0900010_22
- Last Update 08/18/2025
- File Size 1.2MB
- # of Slides 2
- File Format PPTX
- Slide Ratio 16:9
- Color
Keywords
- #Content-Based Slides
- #Design-Based Slides
- #Market and Competitor Analysis
- #Graph
- #Competitor Analysis
- #Competitive Advantage
- #16:9
- #sales trend line graph PowerPoint
- #competitor analysis slide
- #three-line comparison chart
- #market analysis graph slide
- #how to create sales trend visualization in PowerPoint
About the Product
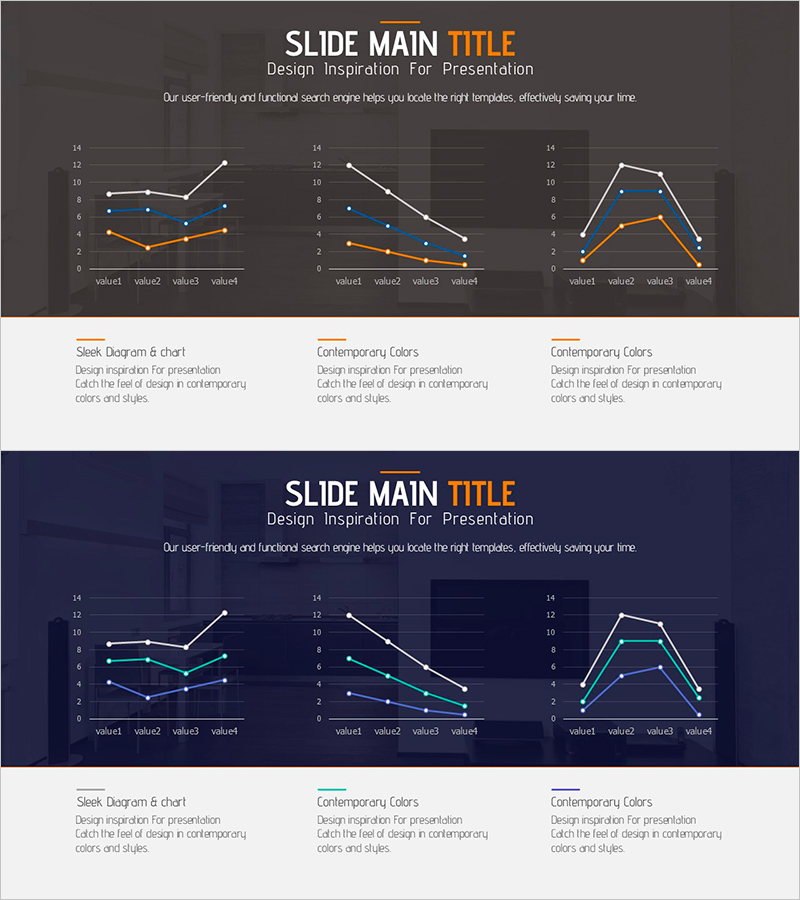
A PowerPoint slide featuring a multi-line chart that compares sales trends and competitor performance simultaneously. Built on a dark gray background with white, blue, and orange lines, this data visualization slide is optimized for market analysis and competitive advantage presentations. The 2-slide set supports various data patterns including growth, decline, and fluctuation trends in 16:9 widescreen format for immediate use in modern presentations. Line colors, data points, and values are fully editable to reflect your actual sales figures and market data.
Usage Points
-
Main Usage
Visualize sales progression, competitor performance, and market trends using multiple data lines. This slide clearly displays quarterly or annual sales changes to effectively communicate market position and competitive strength to executives, investors, and business partners.
-
How to Use
Insert into the market analysis section of business plans, investor presentations, or management reports to explain sales growth rates and competitive performance. Edit line colors, data values, and legends to match your actual figures, creating a credible analytical asset for stakeholder communication.
-
Recommended For
Finance managers, marketing strategists, executives, and investor relations teams use this slide for quarterly performance reviews, market share analysis, and competitive benchmarking. Ideal for investor pitches, board meetings, and strategic planning presentations where growth metrics must be emphasized.
-
Slide Structure
Two-slide set, each containing a three-line trend chart. Layout includes title and description area at top, central chart with four data points connected by trend lines, and legend with explanatory text at bottom for comprehensive data storytelling.
Related Products
-

Doughnut Chart Presentation for Pet Store Competitor Analysis
#Market and Competitor Analysis #Graph #Competitor Analysis
-

Competitor Comparison Analysis Bar Graph
#Market and Competitor Analysis #Graph #Competitor Analysis
-

Competitor Analysis Comparison Area Graph – Visualizing Competitive Edge Data
#Market and Competitor Analysis #Graph #Other
-

Dawn City Theme Competitor Analysis Graph – Understanding Market Trends
#Market and Competitor Analysis #Diagram #Graph
