Utilizing 4 Free Doughnut Charts – Visually Presenting Data
RJ0900009_28
- Last Update 08/18/2025
- File Size 0.1MB
- # of Slides 2
- File Format PPTX
- Slide Ratio 16:9
- Color
Keywords
About the Product
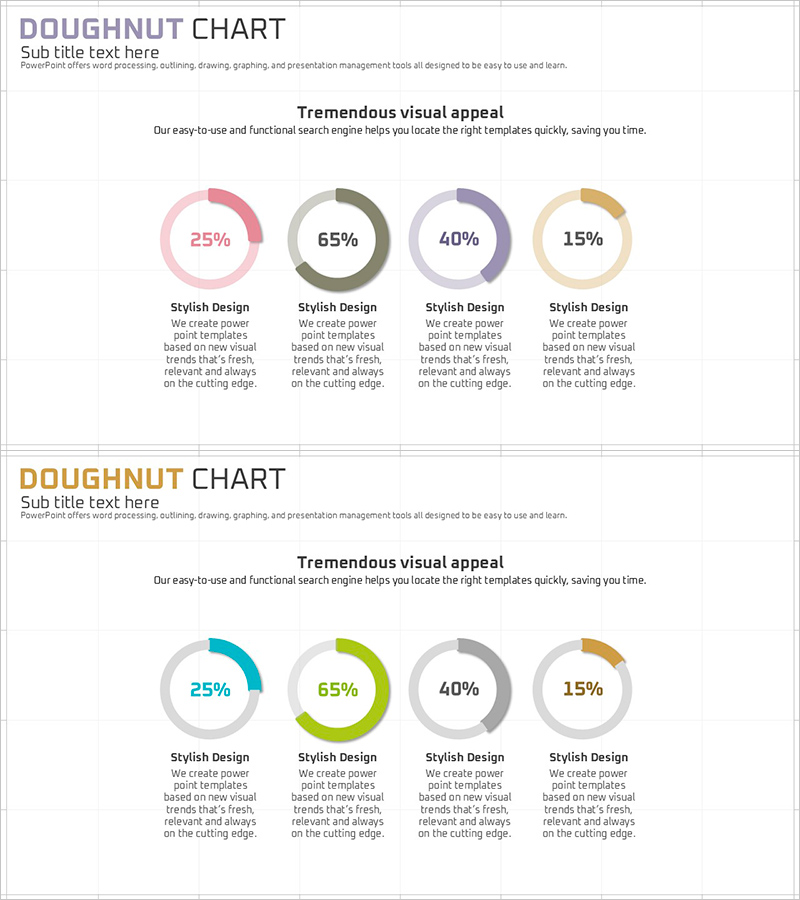
A PowerPoint slide set featuring four doughnut charts in distinct colors: pink, olive, lavender, and beige, displaying data ratios of 25%, 65%, 40%, and 15% respectively. Each chart is fully editable in PowerPoint and designed for business reports, marketing analysis, financial presentations, and performance reviews. The 2-slide layout includes descriptive text areas below each doughnut chart, allowing you to pair visual data representation with contextual insights. Perfect for comparing multiple metrics simultaneously on a single slide.
Usage Points
-
Main Usage
Designed to display and compare four different data ratios simultaneously on a single slide. Each doughnut chart represents an independent metric—such as departmental revenue, customer satisfaction scores, market share, or budget allocation—enabling effective multi-metric communication to audiences.
-
How to Use
Apply to marketing performance reports showing channel-based revenue distribution, financial presentations displaying cost composition, organizational analysis showing departmental headcount allocation, or customer satisfaction surveys presenting item-level ratings. Add context and insights in the text area below each chart to enhance audience comprehension.
-
Recommended For
Finance teams, marketing departments, executive presentations, quarterly and annual performance reviews, customer analysis decks, business proposal data sections, and educational seminars. Ideal when presenting multiple comparable metrics that require parallel analysis.
-
Slide Structure
2-slide layout with a 2×2 grid arrangement of four doughnut charts per slide. Each chart is color-coded (pink 25%, olive 65%, lavender 40%, beige 15%) with central percentage values and outer arc segments. Descriptive text labels and explanation areas positioned below each chart for data context and interpretation.
Related Products
-

Key Personnel Ability Analysis Graph – Highlighting Company Core Strengths
#Company Introduction #Market and Competitor Analysis #Graph
-

Business Analysis Bilinear Bar Graph
#Market and Competitor Analysis #Graph #Competitor Analysis
-

Cement Theme Competitor Analysis Graph – Market Insights
#Market and Competitor Analysis #Graph #Competitor Analysis
-

Competitor Comparison Analysis Graph - Optimized for Market and Competitor Analysis
#Market and Competitor Analysis #Graph #Competitor Analysis
