Business Performance Bar Graph – Strategy and Revenue Forecast
RJ0900008_12
- Last Update 08/17/2025
- File Size 0.9MB
- # of Slides 2
- File Format PPTX
- Slide Ratio 16:9
- Color
Keywords
- #Content-Based Slides
- #Design-Based Slides
- #Business Strategy
- #Market and Competitor Analysis
- #Graph
- #Financial Outlook & Expected Impact
- #Future Outlook
- #Horizontal Bar
- #Horizontal Bar Chart
- #16:9
- #horizontal bar chart PowerPoint
- #bar graph slide template
- #business performance chart
- #revenue forecast graph
- #comparison analysis PPT slide
About the Product
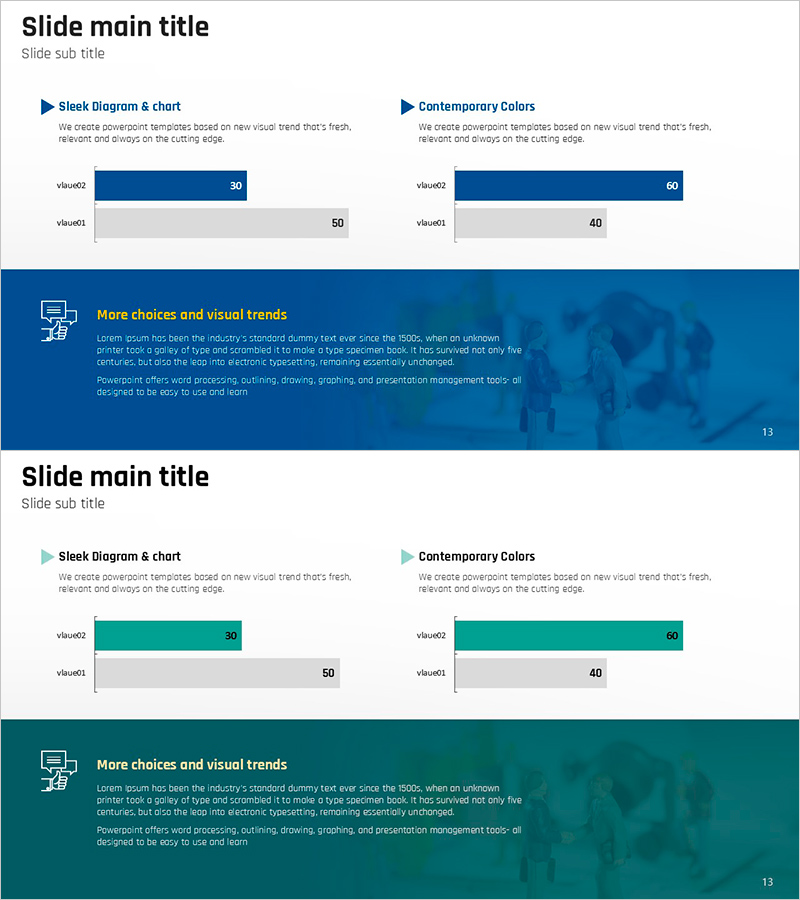
A horizontal bar chart PowerPoint slide designed to clearly compare business performance and revenue forecasts. The template features a navy blue and light gray two-tone color scheme that maximizes data visualization readability. With 2 slides, you can separate strategy implementation and revenue projection stages, with each slide supporting 2-item numerical comparisons. This PPT template is ready to use in business presentations, strategic plans, performance reports, and various corporate documents.
Usage Points
-
Main Usage
Optimized for comparing two key metrics in business strategy implementation and revenue projection phases. Ideal for executive briefings, investor pitches, and strategic planning meetings to convey quantitative data intuitively.
-
How to Use
Replace the bar lengths and numerical values with your own data. Edit the white text and labels on the navy blue background to input business unit names, strategy titles, or revenue categories. The template is optimized for 16:9 widescreen format.
-
Recommended For
Suitable for executives, business planners, marketing managers, financial analysts, and consultants presenting business performance analysis, strategic planning, and revenue forecasting. Recommended for quarterly performance reports, annual business plan presentations, and investor relations materials.
-
Slide Structure
2-slide layout with 2-item horizontal bar charts on each slide. The first slide displays business strategy comparison (value02: 30, value01: 50), and the second slide shows revenue forecast comparison (value02: 60, value01: 40). Navy blue accent color and gray supporting color differentiate data hierarchy.
Related Products
-

Technology Service Future Outlook and Expected Effect – High-Quality Graph Design
#Business Strategy #Market and Competitor Analysis #Graph
-

Future Outlook Vertical Bar Graph – Business Strategy Analysis
#Business Strategy #Market and Competitor Analysis #Graph
-

Global Market Future Outlook Chart – Forward-Looking Business Analysis
#Market and Competitor Analysis #Graph #Market Status
-

Bar Chart & Income Statement Table – Market Analysis and Financial Performance
#Market and Competitor Analysis #Financial Plans and Performance #Diagram
