Detailed Regional Analysis Chart – Market Share Visualization
RJ0900001_23
- Last Update 08/15/2025
- File Size 0.7MB
- # of Slides 2
- File Format PPTX
- Slide Ratio 16:9
- Color
Keywords
- #Content-Based Slides
- #Design-Based Slides
- #Market and Competitor Analysis
- #Graph
- #Market Share
- #Market Analysis
- #Circles
- #Pie Chart
- #16:9
- #pie chart PowerPoint slide
- #circular graph presentation
- #market share visualization
- #regional analysis template
- #3-segment pie chart
- #business data presentation slide
About the Product
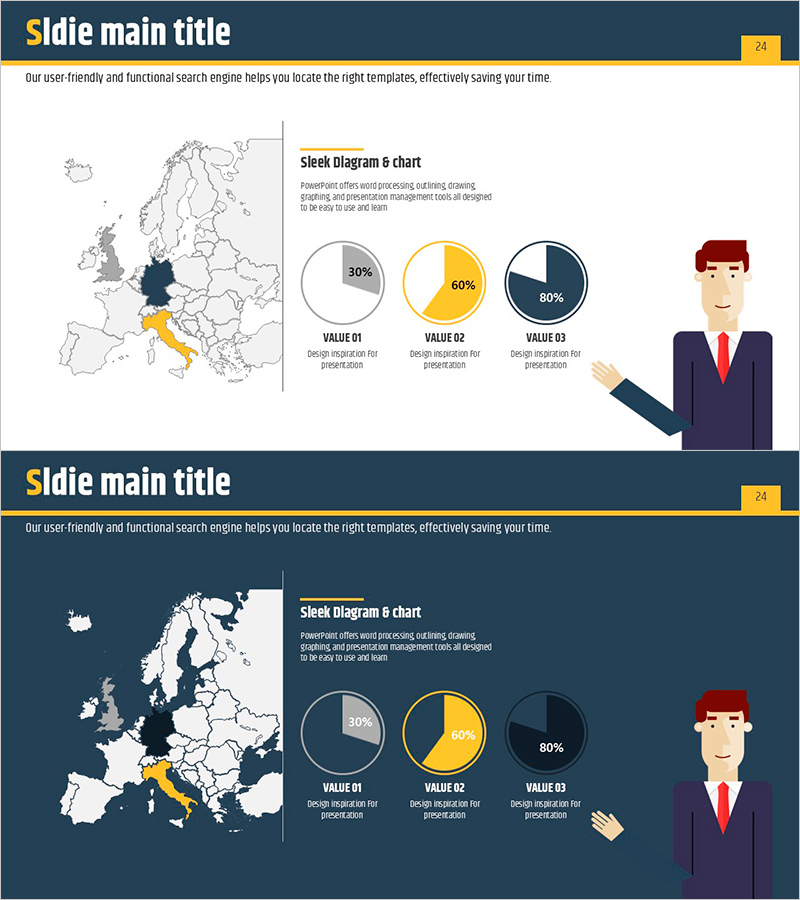
A PowerPoint slide featuring a three-segment pie chart designed for European regional market analysis. The circular graph visualizes market share distribution across three regions using gray, golden yellow, and navy blue color segments. The design incorporates a world map with highlighted regions and a professional businessman illustration, making it ideal for international market analysis presentations. Delivered as a 2-slide set in 16:9 widescreen format (PPTX). Perfect for presenting regional revenue distribution, customer segment breakdown, market penetration rates, and competitive positioning across geographic areas.
Usage Points
-
Main Usage
Visualizes three-item ratio data such as regional market share, revenue distribution by geography, and customer segment breakdown using a pie chart format. The world map and businessman illustration emphasize global market analysis expertise, making it suitable for executive reports, investor presentations, and strategic marketing briefings.
-
How to Use
Input numerical values into each pie segment, and the proportional representation updates automatically. The gray, golden yellow, and navy blue colors are fully editable to match corporate brand guidelines. The world map's highlighted regions can be customized to focus on specific markets. Text labels and legend clearly identify each data segment.
-
Recommended For
Ideal for executives, finance teams, marketing departments, and sales teams presenting market analysis findings. Particularly effective when emphasizing three-item ratio comparisons such as regional revenue composition, customer distribution, and market share breakdown. Recommended for international business meetings, quarterly earnings reports, and new market entry strategy presentations.
-
Slide Structure
Slide 1: Three-segment pie chart (30%, 60%, 80% sample data) in gray, golden yellow, and navy blue, paired with a world map highlighting Germany and Italy, plus a professional businessman illustration. Slide 2: Dark background version with identical layout but navy blue background for enhanced contrast. Both slides feature VALUE 01, VALUE 02, and VALUE 03 labels for clear data identification.
Related Products
-

Detailed Analysis Pie Chart – Market Share and Promising Competitors
#Market and Competitor Analysis #Graph #Market Share
-

A Lively Green Orange Pie Chart
#Market and Competitor Analysis #Graph #Market Share
-

Sailing Travel Business Market Share Pie Chart Analysis
#Market and Competitor Analysis #Graph #Market Share
-

Performance Analysis Pie Chart – Market Share Visualization
#Market and Competitor Analysis #Diagram #Graph
