Construction Work System Diagram – Intuitive Flow Display
RJ0900006_8
- Last Update 08/17/2025
- File Size 0.1MB
- # of Slides 2
- File Format PPTX
- Slide Ratio 16:9
- Color
Keywords
- #Content-Based Slides
- #Design-Based Slides
- #Product/Service Introduction
- #Business Introduction
- #Diagram
- #Features
- #Revenue Model
- #Flow
- #Circular Flow
- #16:9
- #circular diagram PowerPoint
- #3-step cycle slide
- #PowerPoint process flow diagram
- #cycle diagram template
- #how to create circular diagram in PowerPoint
About the Product
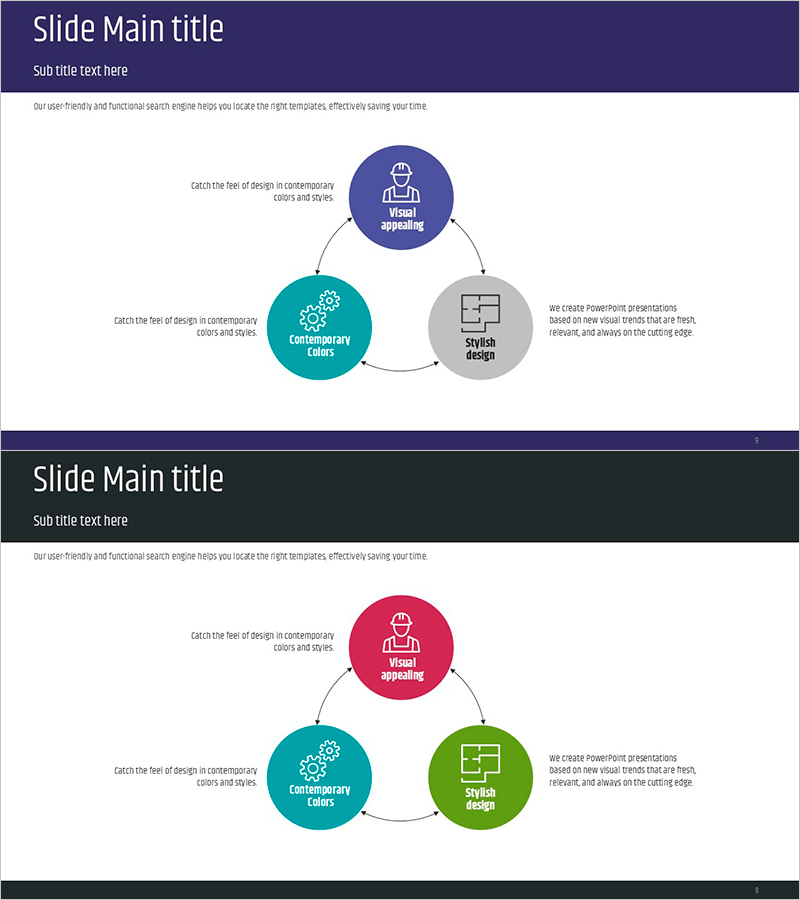
A three-node circular diagram PowerPoint slide designed to visualize project phases, work cycles, and continuous processes. The harmonious color combination of blue, teal, and gray emphasizes visual flow, while icons and text labels on each node ensure clear information delivery. Formatted in 16:9 widescreen with 2 slides, this presentation template is ready for immediate use across various business contexts. The arrow-connected circular structure intuitively represents iterative processes, continuous improvement, and cyclical relationships.
Usage Points
-
Main Usage
Ideal for visualizing project phases, work cycles, continuous improvement processes, and cyclical relationships. Each node can be customized with team member names, roles, or phase titles to clearly communicate repetitive workflows within your organization.
-
How to Use
Use in company overview, business plan, or operational strategy slides when explaining workflow processes. Modify node text and icons to match your organizational context, and adjust colors as needed to align with brand guidelines.
-
Recommended For
Recommended for project managers, operations teams, quality assurance specialists, and process improvement coordinators presenting team workflows. Highly effective in construction, manufacturing, and service industries for illustrating work systems and cyclical structures.
-
Slide Structure
Three circular nodes connected by directional arrows in a cycle. Each node contains an icon, title, and descriptive text. Color-coded nodes: blue (top), teal (left), gray (right). Two color scheme variations provided: blue-teal-gray and pink-teal-green combinations.
Related Products
-

System Operation Plan Diagram – Embodying Technical Excellence
#Product/Service Introduction #Technical Approach #Diagram
-

Operating Method Characteristics Circular Diagram
#Product/Service Introduction #Technical Approach #Diagram
-

Stylish Presentation Slides with Eye-Catching Design Inspiration
#Business Introduction #Operational Plan #Diagram
-

Legal Advice Area Diagram – Effective Flow Presentation
#Product/Service Introduction #Diagram #Product/Service Introduction
